Journal Information
Title: Enfoque UTE
Abbreviated Title: Enfoque UTE
ISSN (print): 1390-9363
ISSN (electronic): 1390-6542
Publisher: Universidad UTE (Quito, Ecuador)

This research is an extension of the article titled “Optimal Allocation of Transformers in Electrical Distribution Systems Considering Attenuation and Capacity Constraints”, previously presented at the 4th INCISCOS 2019 International Conference held in the city of Quito - Ecuador.
Traditional electrical networks become smart grids if communications infrastructure is added, some researches about technologies are described considering optimal communications and infrastructure in HAN (Maldonado, 2017), NAN (Quishpe, Padilla & Ruiz, 2019; Ruiz, Masache & Inga, 2018; Ruiz Maldonado & Inga, 2019) and WAN (Ruiz & Inga, 2019; Ruiz, Masache & Domínguez, 2018).
Distribution systems play an essential role since it interconnects the transmission system and the users. Research efforts in the area have been directed toward developing methodologies for optimal design, planning, and expansion of modern electrical distribution systems (Carrión Galarza & González Sánchez, 2019).
Traditional design methodologies must minimize the associated costs, such as investment, energy losses, operation and maintenance while keeping satisfactory levels of security and reliability. Information about the electrical distribution network, such as location and ratings of generators, substations, transformers and lines, and the electric energy demand of the users is key for solving this optimization problem. However, publicly available data from a real network is generally scarce. Therefore, considering the demand increase, when planning distribution networks, typically requires the use of artificial models that emulate the real infrastructure. The optimal design of smart distribution networks is a combinatorial problem defined as NP-complete, next papers show different methodologies for design electrical networks (Liu et al., 2017; Xie et al., 2018); where the connection between customers and the main node on a georeferenced scenario is build using a model based on minimum spanning tree (MST) techniques.
The project deals with the optimal location of distribution transformers using a modified-prim algorithm based on the minimal cost of low voltage network between transformers and users. Secondly, clustering algorithms are used to break the dataset (number of distribution transformers) up into groups, then the k-medoids algorithm determines a defined number of clusters, which can be used as primary feeders. The next stage deals with the built-up of the medium voltage network based on modified-prim (Gholizadeh-Roshanagh, Najafi-Ravadanegh & Hosseinian, 2018; Xie et al., 2018) to determine the lowest path between the main substation and distribution transformers on a georeferenced path. The minimum spanning tree (Li, Mao, Zhang & Li, 2016) is estimated with the Prim algorithm and graph theory. Prim is used to finding the subset of branches and all vertices that will constitute the tree. The constraint related to the losses due to distances is taken into account during the process. In each iteration, the algorithm increases the tree size, starting from an initial vertex representing a transformer and successively adding vertices corresponding to the users, such that the distances between the transformer and the users are minimized, initial works in telecommunications. This process considers variables such as location of the householders’ main feeders, location, and ratings of transformers and path of medium and low voltage along the streets; it also takes into account constraints such as power flow balance/equality, the location of a substation, the path of lines, bus voltage and ratings and coverage of each transformer. Regarding the latter, any transformer that does not satisfy the requirements is to replace. The proposed model in this paper is to develop considering a multigraph, that defines a layer for the medium voltage network and another layer for the low-voltage network, ensuring the connectivity of users in the deployment depending on demand. To achieve the objectives a deployment is carried out in urban areas using an open street map (OSM) (Once, 2017) file with the information of longitude and latitude within a model developed in Matlab. The efficiency of the model is estimated for varying densities of the electric load, to assess adaptation capability and resources available to fulfill the demand of a different number of users. The k-means algorithm is used for generating the clusters, and the nodes inside an area are treated as PQ loads. Such a network is generated through the Delaunay-Voronoi triangulation (Budka, K., Deshpande, J. and Thottan, 2014; Ciechanowicz, Pelzer, Bartenschlager, & Knoll, 2017), thus resulting in a partially connected mesh. If such mesh network shows a redundancy larger than desired, branches are iteratively suppress starting with the one connecting two nodes with the highest degree.
Henceforth, this article is organized as follows. Section 2 presents the methodology of the problem, where the proposed algorithms and procedures for optimization are formulated. Section III presents results and discussion, describing and analyzing the information obtained by applying the optimization model on simulation scenarios with different parameters. Finally, in section V, the conclusions and recommendations about this research.
Planning electrical distribution networks involves, among other aspects, taking some initial considerations that allow defining preliminary parameters to their implementation on the optimization model. The considerations included in the research respond to the deployment of a new power grid. This implies that existing distribution network is not considered, or in turn, it does not exist. Items considered, such as location of users, candidate sites and possible routes for the deployment of the electricity network, are identified using georeferenced data from the OpenStreetMap platform after their processing in MATLAB. In addition to characterization of the scenario, the object of the implementation of georeferenced information lies in the ability to facilitate the obtaining of coordinates where the location of the electrical transformers is adequate. Being this, one of the results obtained through the model presented. Table 1 shows the variables of equations and algorithms shown later.
Being 𝑁 the number of users and 𝑀 the number of candidate sites, it is sought to minimize the number of candidate sites considering the spacing between transformation centers, and their maximum capability; which must be greater than the sum of the power demanded by users connected to the equipment, ensuring that the specified transformability will not be exceeded. The mathematical expressions that respond to the above are presented below, being (1) the objective function, (2) spacing restriction and (3) maximum transformation capability restriction.
(1)
(2)
(3)
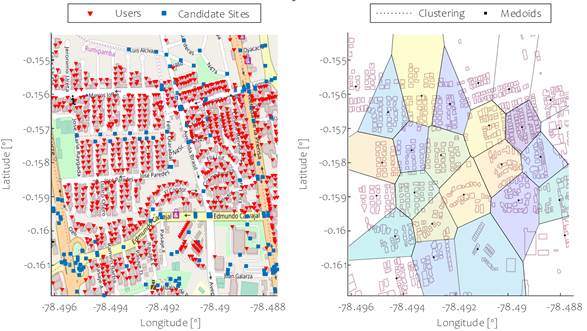
Once the scenario is characterized and after defining the candidate sites for the location of transformers, taking into account the characteristics of the design area; a scenario where a large number of users are available could involve excessive complexity to perform optimization in large blocks, so it is chosen to cluster the design area in a way that makes routing easier by creating subnets. Sectorization is done using the k-medoids clustering method, thus dividing the environment into regions while building a graph connecting the different nodes in the georeferenced area. The clustering result is also used for assigning random loads to each user. Also, Delaunay and Voronoi triangulation methods are used to visualize sectorization. After that, it is proposed to solve the problem of optimal location using the modified-Prim and Greedy algorithms. The above process is carried out when applying Algorithm 1.
From Algorithm 2, modified-Prim method allows building a minimum expansion tree over the network. The graph obtained includes all the vertices of the network where the sum of its edges is minimum, the weights of the graph are the distances between users and candidate sites obtained by the haversine formula. On the other hand, the Greedy algorithm allows obtaining an array with logical values that show those active transformers that will meet the demand of the different user blocks. However, the array of logical values obtained with Greedy can present minor problems, such as providing a solution that includes more than one transformation unit for the same user, which would result in incorrect transformer sizing and, in general, unwanted redundancy errors. Therefore, the algorithm considers that particularity and corrects it.
The procedure implemented by Algorithm 2 allows determining the capability of the transformers and after the nominal power of each transformer has been obtained, the algorithm performs a calculation of the existing distances for the set of users covered by a transformer using the haversine formula, this procedure is applied to the full extent of the distances between a user and its assigned transformer; with this data, voltage drop calculations are performed based on the parameters of the established conductor, as well as electrical factors typical of the network and demand, such as voltages in secondary and power factor.
MATLAB R2018b software is used to implement the proposed methodology on a computer with an Intel Core i7-6500U processor, 8 Gb of RAM, and Windows 10. The proposed scenario has 824 users and 163 candidate sites located at the intersections of the georeferenced area, obtained after recognition by interpreting geographical information. The proposed georeferenced area is shown in Figure 1, along with the location of the candidate sites, users and clustering of the area.
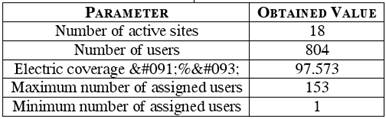
Table 2 shows results achieved after applying the optimization methodology on the proposed scenario. In order to obtain these values, the spacing and maximum transformation capability parameters considered were 100 meters and 200 KVA, respectively.
As can be seen, 18 active sites are obtained, which refer to the set of coordinates marked by the model as optimal to the location of transformation centers. The number of active sites represents eleven percent of the total available sites. On the other hand, while the set of transformation units to be deployed on the network does not guarantee a total supply of demand, since the coverage is not 100 %; the number of users not supplied is minimal, so they could be assigned to a transformer with low loadability. In this sense, the table also shows information about the maximum and minimum number of users assigned to a transformer. This data shows the condition of certain units in which the number of users is minimal, so they can withstand higher load and therefore will be able to supply the entire demand.
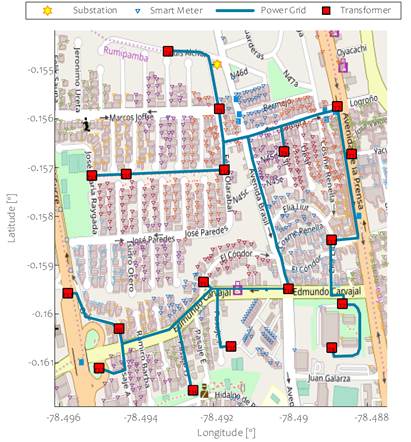
Figure 2 shows the georeferenced area with the deployment of the transformation units located at the coordinates rated as optimal. In addition, the primary of the electrical network covering each of the active transformation units is shown. This network constitutes a possible route for the deployment of the power grid.
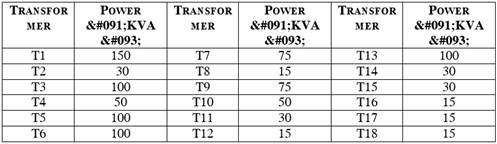
Table 3 shows the capability of each transformation unit located in the georeferenced area. Values presented are based on standard values. The maximum capability obtained after sizing reaches 150 KVA in a single unit, ensuring compliance with the maximum capability constraint.
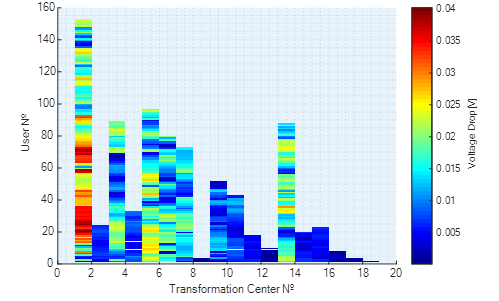
Voltage drops, corresponding to the secondary circuits of the network, cover the sections between each user and its assigned transformer. Figure 3 shows these drops obtained by using the following parameters: voltage 120 volts, power factor 0.85 and 1/0 aluminum conductor. Thus, the maximum voltage drop would be around 0.04 volts, which is 0.033 % of the total voltage. However, most users would have drops ranging from 0.01 to 0.025 volts. Consequently, it can be said that the expected voltage attenuation should not violate the standards for distribution systems. Voltage drops are calculated only in secondary circuits due to the model handles user and active transformer locations. So, with such parameters, it is possible to calculate distances and therefore voltage drops between users and their assigned transformer. The voltage drop in primaries is not addressed since the model does not perform optimal network routing. In addition, Figure 3 shows the distribution of users for each of the active transformers, providing an overview of the coverage of each transformer. Furthermore, the maximum and minimum number of users connected to a transformer is appreciated, in accordance with data shown above in Table 2.
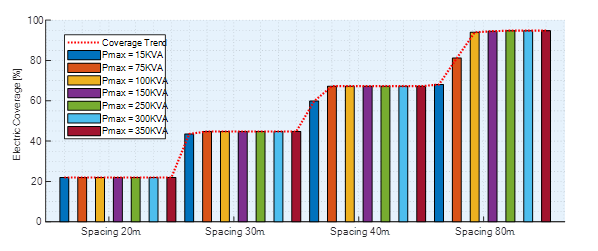
Another aspect to be evaluated is the percentage of electrical coverage achieved after the location of the transformation centers. Since no coverage constraints are introduced, this parameter is not controlled, however, the results achieved expose a marked trend. Figure 4 shows coverage values obtained after applying the optimization methodology considering changes in the restrictive parameters of the model. The minimum coverage values are placed when using as the spacing distance of 20 meters. For this distance, even when the maximum transform capability changes, coverage remains fixed at approximately 22 %. Similarly, it occurs for spacing values of 30 and 40 meters, with coverage values of 45 % and 67 %, respectively. For spacing values of 80 meters, coverage improves considerably, except for results obtained for powers less than 100 KVA, the coverage reaches approximately 95 %.
Following the trend, coverage below the tested minimum distance is expected to be low and above the maximum distance tested would be greater than 95 %. However, the distance parameters used as constraints do not fit the needs of an actual distribution system. Since even the distance between poles should be commonly greater than 40 meters. Even, as a minimum spacing a distance less than that value, involves violating the minimum distance requirement between posts and, considering a spacing value equal to 40 meters, would imply the possibility of placing a transformer on each post, which nor does it fit the reality. Generally, transformers are located at distances of not less than 100 meters and as presented above, the coverage achieved under that distance is around 96 %.
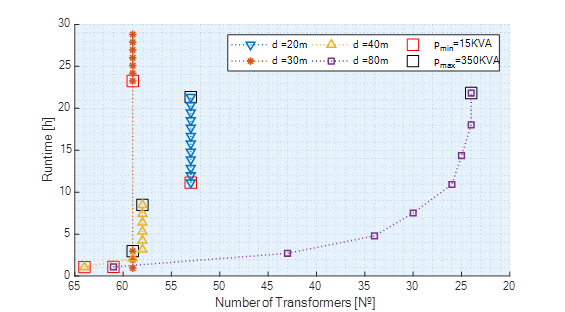
Figure 5 shows data regarding execution times as a result of applying the optimization methodology and the variation of its restrictions. It should be noted from this figure that the markers refer to the maximum and minimum powers used for the creation of the different scenarios, which correspond to 350 KVA and 15KVA, respectively. These values correspond to the power horizons used, however, among these values there are more power parameters. Having said that, it can be observed that for a spacing of 20 meters all the results obtained yield the same asset site numbers, specifically, 53. Although the number of active transformes is the same, execution times experience an increase, starting from 11 hours, for the minimum horizon, to 21 hours, on the maximum horizon. Similarly it happens with the spacing of 30 meters, obtaining a number of active sites of 59, in this case the execution time presents a decrease, so the maximum execution time is 29 hours and the minimum 1 hour. For the spacing of 40 meters, different numbers of active sites were obtained, starting with 64 to reach 58 active sites, with times ranging from 1 hour to 9 hours, being that, in the same way, there is an increase in the execution time. Finally, with the spacing of 80 meters, different numbers of active sites were obtained forming a growing curve in time and decreasing in number of transformers. In the latter, times range from 1 hour to 22 hours.
The optimization methodology presented uses georeferenced information for the characterization of the scenario. It includes identifying users, candidate sites, and possible routes for network deployment. This work considers the deployment of a new power grid and the model does not identify or consider existing networks. So, in a scenario where a network is already deployed, the results can help assess whether the current location of the transformation units is adequate and if it is not, to consider the relocation of the transformer, this, accompanied by specific analyses as economic implications.
Voltage drops achieved do not exceed the typical maximum permissible values stipulated by regulations for electrical distribution systems. The resulting values show an adequate location of the transformers, as their reduced magnitudes respond to a well-achieved proximity between users and their assigned transformer, this implies that the distance between them is small and as a result, little attenuation is achieved.
Assignment of users to each transformation unit is not uniform, presenting cases in which a transformation unit covers just a single user. This is justified in cases where the user has a high electrical demand. And even if the above does not stick to reality, such units can be considered in the expansion of the distribution system.
The coverage obtained in scenarios with spacings less than 80 meters is limited, however, the use of such parameters is not applicable to the requirements of a distribution network, since, as explained during the analysis, some of these values involve the possibility of placing transformers on each of the poles in the distribution network. With spacings greater than 80 meters the coverage reaches quite acceptable levels, above 95 %. Despite achieving acceptable levels for certain ranges, future research should include coverage restrictions to ensure full demand supply, even if the restrictions do not adhere to the actual requirements of a distribution network.
Budka, K., Deshpande, J., Thottan, M., 2014, Communication Networks for Smart Grids, Making Smart Grid Real., London, Springer-Verlag, https://doi.org/10.1007/978-1-4471-6302-2.
Carrión Galarza, D. F., & González Sánchez, J. W. (2019). Ubicación óptima de PMU considerando restricciones de contingencias N-1 en sistemas eléctricos de potencia. Enfoque UTE,, 10, 1-12, https://doi.org/10.29019/enfoqueute.v10n1.437.
Ciechanowicz, D., Pelzer, D., Bartenschlager, B., & Knoll, A. (2017). A modular power system planning and power flow simulation framework for generating and evaluating power network models. IEEE Transactions on Power Systems, 32, 2214-2224, https://doi.org/10.1109/TPWRS.2016.2602479.
Gholizadeh-Roshanagh, R., Najafi-Ravadanegh, S., & Hosseinian, S. H. (2018). framework for optimal coordinated primary-secondary planning of distribution systems considering MV distributed generation. IEEE Transactions on Smart Grid,, 9, 1408-1415, https://doi.org/10.1109/TSG.2016.2590425.
Li, H., Mao, W., Zhang, A., & Li, C. (2016). An improved distribution network reconfiguration method based on minimum spanning tree algorithm and heuristic rules. International Journal of Electrical Power and Energy Systems, 82, 466-473, https://doi.org/10.1016/j.ijepes.2016.04.017.
Liu, J., Cheng, H., Xu, Q., Lan, Z., Zeng, P., & Yao, L. (2017). Stochastic expansion planning of interconnected distribution networks with renewable sources considering uncertainties and power transfer capability. (October):, 1600-1604, https://doi.org/10.1049/joe.2017.0602.
Maldonado, M. G. R., 2017, Wireless Sensor Network for Smart Home Services Using Optimal Communications., International Conference on Information Systems and Computer Science, INCISCOS, https://doi.org/10.1109/INCISCOS.2017.21.
Ruiz, M., & Inga, E. (2019). espliegue óptimo de redes ópticas para comunicaciones en redes eléctricas inteligentes. I+D Tecnológico, 15, 79-85, https://doi.org/10.33412/idt.v15.2.2249.
Ruiz, M., Masache, P., Inga, E., 2018, Optimal Communications for Smart Measurement of Electric Energy Reusing Cellular Networks. 2018 International, Conference on Information Systems and Computer Science, INCISCOS, https://doi.org/10.1109/INCISCOS.2018.00036.
Ruiz Maldonado, M. G., & Inga, E. (2019). Asignación óptima de recursos de comunicaciones para sistemas de gestión de energía. Enfoque UTE, 10, 141-152, https://doi.org/10.29019/enfoqueute.v10n1.447.
Xie, S., Hu, Z., Zhou, D., Li, Y., Kong, S., Lin, W., & Zheng, Y. (2018). Multi-objective active distribution networks expansion planning by scenario-based stochastic programming considering uncertain and random weight of network. Applied Energy,, 207-225, https://doi.org/10.1016/j.apenergy.2018.03.023.