Journal Information
Title: Enfoque UTE
Abbreviated Title: Enfoque UTE
ISSN (print): 1390-9363
ISSN (electronic): 1390-6542
Publisher: Universidad UTE (Quito, Ecuador)

Due to the environmental crisis and growing demand for energy, the development and implementation of renewable energy has become a matter of great importance. Solar energy is a promising source of energy due to its free availability and low operating costs, along its being a non-polluting source (Li, Liu, Guo, & Zhou, 2017; Kannan & Vakeesan, 2016). Solar energy can be used in solar water heating systems, pool heaters and other heating systems (Ingle, Pawar, Deshmukh, & Bhosale, 2013). Within solar energy systems, the main component is the solar collector, which is a heat exchanger that absorbs and captures incident solar radiation converting it into heat and then transferring the heat to a fluid (usually water or air) that flows through the collector.
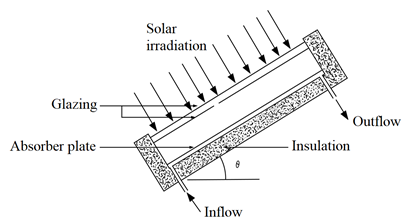
Although solar flat plate collectors produce lower temperatures, they have the advantage of being simpler in design and having lower maintenance costs and thus are the most used collectors for solar heating systems in the residential and industrial sectors (Ingle, Pawar, Deshmukh & Bhosale, 2013; Birhanu, Ramayya & Shunki, 2016). A typical flat plate collector consists of an insulated metal box with a glass or plastic cover, and a dark-colored absorber plate (Karanth, Madhwesh , Kumar, & Manjunath, 2015), as shown in Figure 1.
According to Matrawy & Farkas (1997), the configuration of a solar collector is an important factor that determines its thermal performance. A solar collector with a serpentine tube works better than a conventional collector with parallel tubes due to the earlier appearance of turbulent flow that improves the application of heat transfer and increases its maximum efficiency from 62 % to 65 %. Myrna & Beckman (1998) concluded that the internal heat transfer coefficient, which increased approximately 3 % when a serpentine flat plate collector was used, was the main reason for the performance difference between a conventional flat plate collector and a serpentine flat pate collector. Eisenmann, Wiese, Vajen & Ackermann (2000) conducted experiments on two serpentine flat plate collectors, which had the same shape and geometry. In the first collector, the serpentine tube was welded directly to the absorber plate; whilst in the second collector, the serpentine tube and the plate were joined without thermal fusion. Both collectors were placed under the sun in identical weather conditions and their performances were compared. The efficiency of the first collector increased from 2 % to 2.5 %.
Investigations by Prakash, Vishnuprasad & Ramana (2013) and Madhukeshwara & Prakash (2012) showed that the use of special surface coatings improves the optical properties of the collector, the operating temperatures and the performance of the system. Sopian, Syahri, Abdullah, Othman & Yatim (2004) experimentally studied the performance of a new design of solar water heater, where the collector and storage tank were integrated into the same unit. The temperatures registered in the storage tank oscillated between 60 and 63 °C with a radiation of 700 W/m2 and the efficiency of the system was 45 % with an ambient temperature of 31 °C.
Prasad, Byregowda & Gangavati (2010) conducted an experimental study on a water heater with a flat plate collector and a solar tracking mechanism increasing the system’s thermal efficiency by 21 %, approximately. Meanwhile, Basavanna & Shashishekar (2013) analyzed a flat plate solar collector with triangular pipes obtaining an increase in the water outflow temperature up to 330 K. Shelke & Patil (2015) analyzed the effect of variations in tube shapes for flat plate solar water heater. They compared the outlet temperature between an elliptical tube and a circular tube, concluding that elliptical tube gives the maximum outlet temperature of water for the same heat flux and inlet temperature. The outlet temperature difference between circular and elliptical tube was 4.17 °C.
Selmi Al-Khawaja & Marafia (2008) simulated and analyzed a flat plate solar collector using a Computational Fluid Dynamics (CFD) software. An experimental model was built and experimental tests were performed to validate the CFD model, obtaining good results. The simulated temperature curve has the same behavior as that experimental one and they are similar. A numerical and experimental investigation of the flow and temperature distribution in a solar collector was performed by Ranjitha, Somashekar, & Jamuna (2013), they investigated the influence of the tube shape and the absorber plate effect on flow and thermal distribution with CFD simulations. The comparison between CFD simulations and the experimental measurements showed only 5 % deviation.
Muhammed & Benny (2015) analyzed the performance of a flat plate solar collector using ANSYS Fluent. They investigated the effect of certain important parameters such as mass flow, material of the absorber plate and variations in the shape of the collector tubes by comparing the inflow and outflow temperature of the fluid. Meanwhile, also using ANSYS Fluent, Mukesh (2016) compared the CFD solutions of different used forms of absorber plates in flat plate collectors. The plate with the best results was selected to be manufactured. They concluded that CFD analysis is an effective tool for researchers to simulate several models in different operating conditions, without manufacturing them comparing their results, saving time and money.
Vasudeva, Manjunath & Yagnesh (2011) analyzed the performance of a flat plate solar collector by using the Discrete Transfer Radiation Model (DTRM). They observed that the heat transfer to the fluid due to solar radiation increased when mass flow rate increased, while the temperature of the absorber plate decreased. Additionally, Marroquin, Olivares, Jiménez, Zamora & Encinas (2013) performed the CFD simulation of two collectors with different cross sections, with a rectangular and a circular cross section. Both showed a temperature increase up to 62.5 °C. The authors also determined the Reynolds number for each collector; collector A presented a variation of 25 < Re < 115, whilst collector B showed a variation of 200 < Re < 225, concluding that collector B was the most efficient since it presented a more uniform flow.
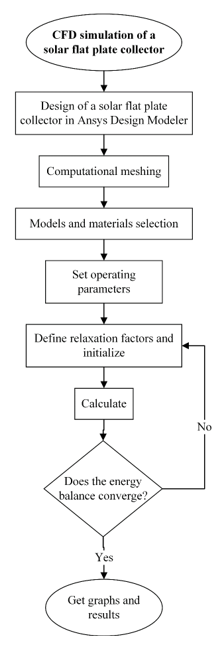
There are not a lot of investigations about cross sections of the solar collector, through which the fluid flows, the selected sections were chosen according to a thermal analysis. CFD model proposed in the present investigation was validated with the simulation performed by Gunjo, Mahanta & Robi (2017) in their research entitled "CFD and experimental investigation of flat solar water heating system under steady state condition". Figure 2 shows the used process to carry out the presented investigation.
The aim of this study is to investigate the effect of operating parameters on the performance of a solar flat plate collector with different cross sections component of a direct expansion solar assisted heat pump (DX-SAHP). A mathematical description of the system governing equations is presented, and the effect of different cross sections was analyzed.
2. Numerical modelling
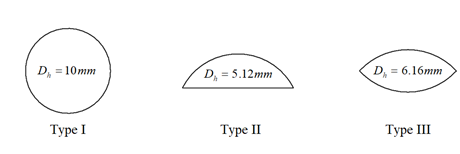
This study analyzed three geometries for the cross section of a pipe of a conventional flat plate collector, as shown in Figure 3. The behavior of the fluid and performance of the solar collector are studied using the three configurations.
2.1. Governing equations
For the CFD analysis, ANSYS Fluent 16 was used to determine the water outflow temperature, as well as the heat distribution in the plate by solving the equations of continuity, momentum and energy (ANSYS Fluent Theory Guide 12.0, 2009; ANSYS Fluent User Guide, 2012):
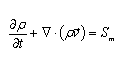
Continuity equation
The source Sm is the added mass to the continuous phase from the second dispersed phase.
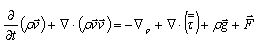
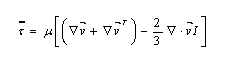
Moment equation
Where is the stress tensor:
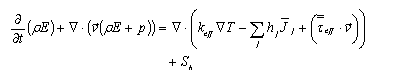
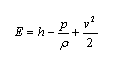
Energy equation
In Equation 4,
2.2. Computational domain
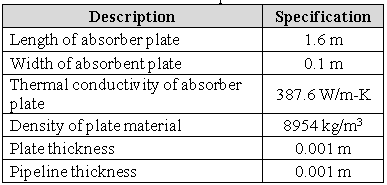
The length, width and thickness measurements of the collector are 1.6, 0.1 and 0.001 m, respectively, whilst the dimensions of the pipe cross section vary according to the type of the used section. Table 1 shows the main characteristics of the collector used in this investigation.
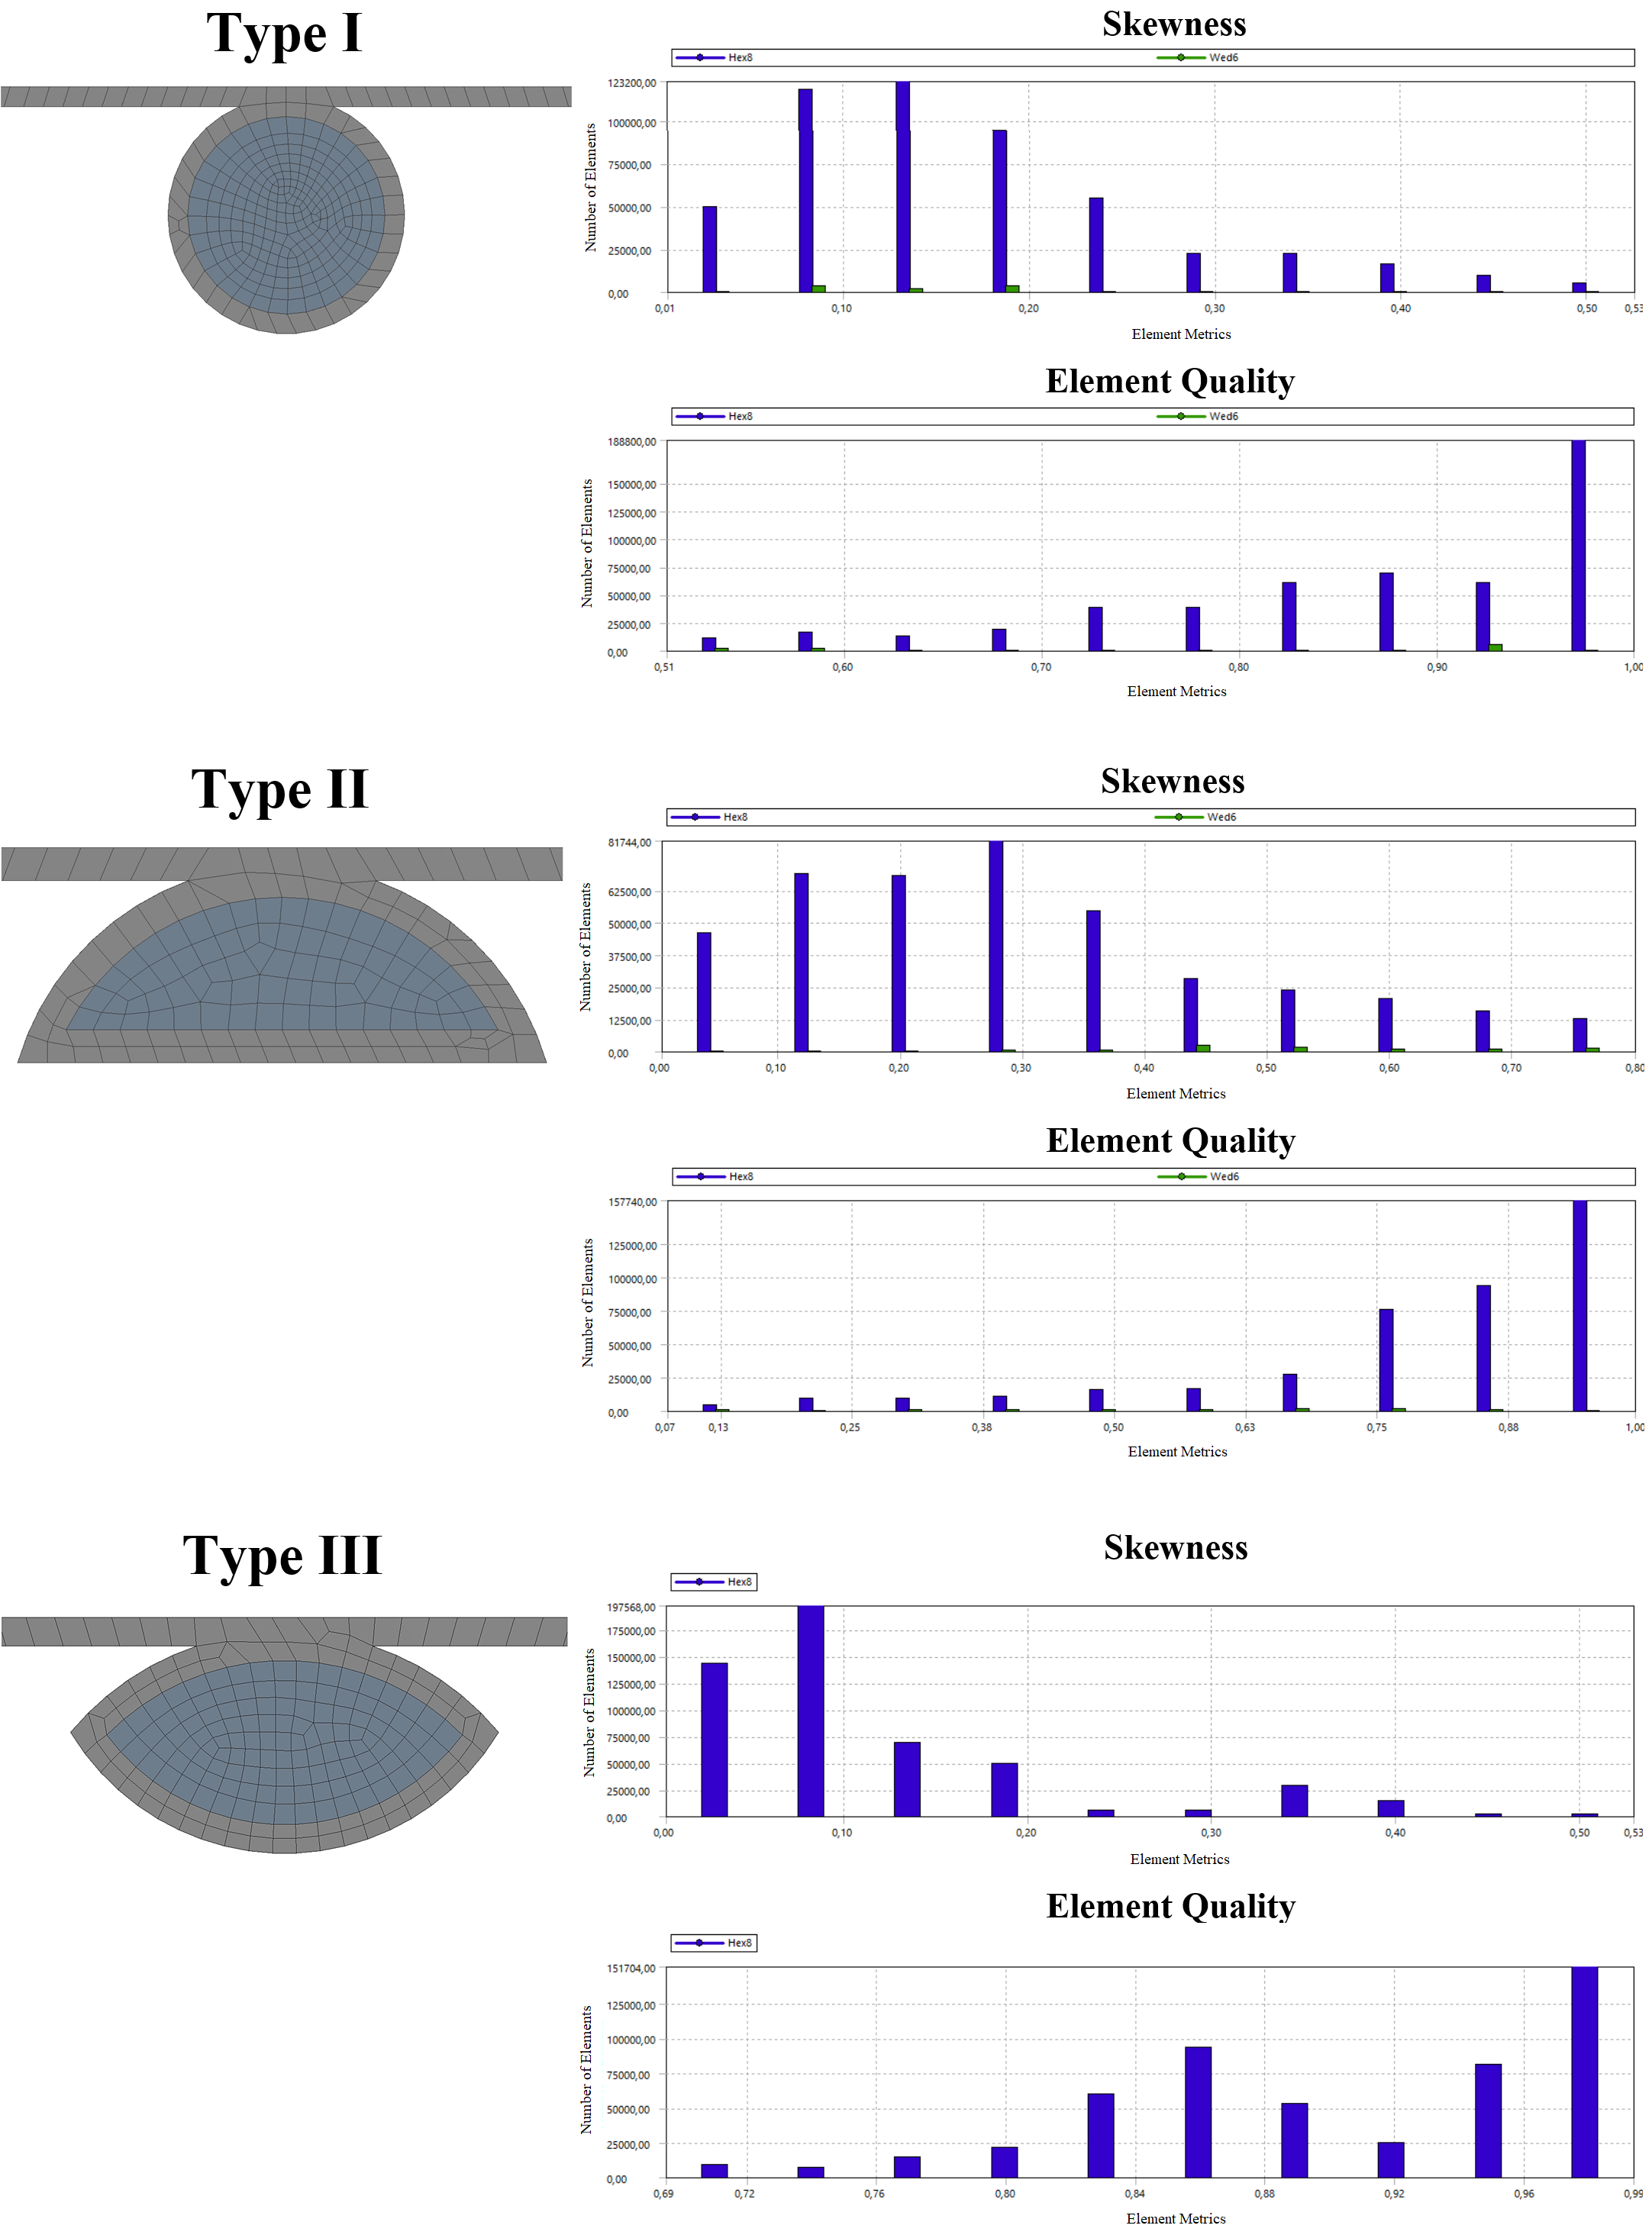
Domain discretization was done considering a structured grid consisting of hexahedral elements of 0.8 mm for the fluid part and 1 mm for the solid part. The number of registered elements in the mesh for the computational domain consisting of water, water pipe and absorber plate are 523200 for Case I, 425780 for Case II and 515088 for Case III. Figure 4 shows the used 3D meshes for the different sections, as well as their skewness and their element quality.
2.3. Simulation conditions
The analysis was carried out based on the following assumptions:
The physical and thermal properties of the absorber plate, pipe and water are independent of the temperature.
Water is a continuous and incompressible.
The flow is stable and has characteristics of laminar flow.
The heat loss from the bottom of the plate and the tube is by convection, which depends upon wind speed
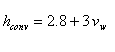
A constant heat flux (solar radiation) is applied to the upper part of the plate, whilst the lower part is established as a convective surface where the convective heat transfer coefficient is obtained by (Gunjo et al., 2017):
Where:
hconv Convective heat transfer coefficient, W/m2-K
Vw Wind speed, m/s
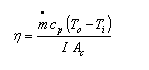
The efficiency of the solar collector is determined by:
Where:
m Mass flow of fluid, kg/s
Cp Specific heat of the fluid, J/kg-K
Ti Fluid inflow temperature, K
To Fluid outflow temperature, K
I Solar radiation, W/m2
Ac Effective area of the collector, m2
The parameters of solar radiation, ambient temperature, water inflow temperature and mass flow used in the computational model are shown in Table 2.
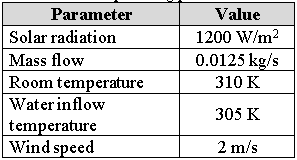
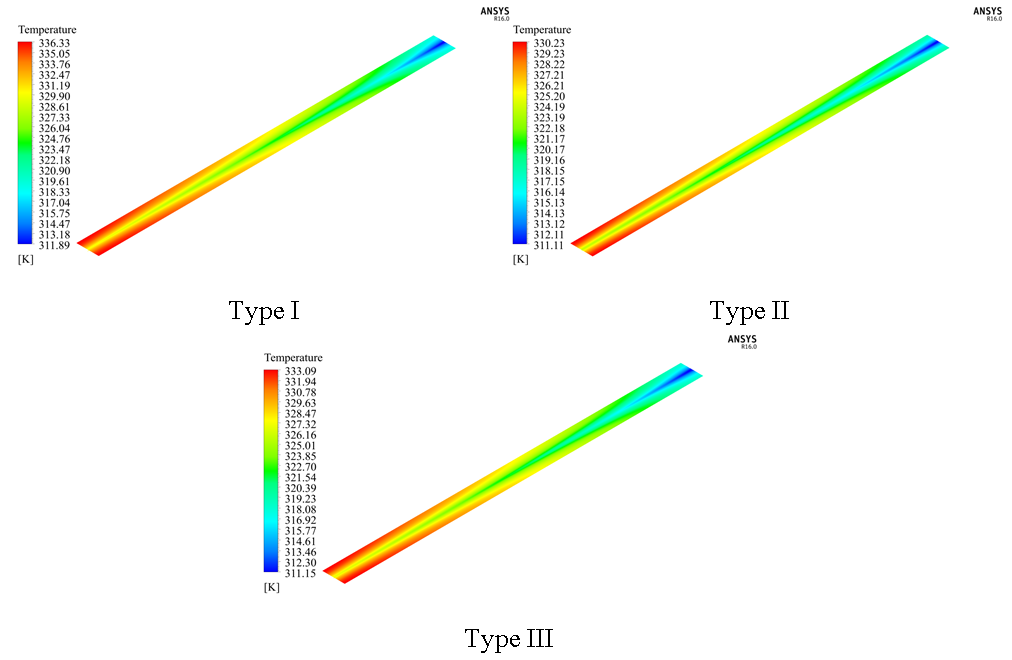
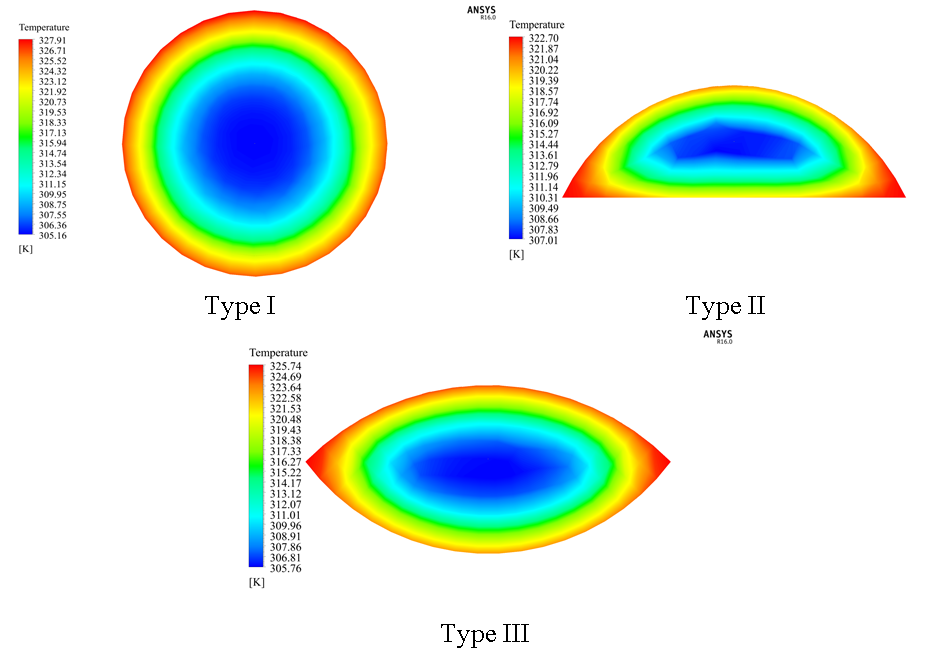
Figure 5, Figure 6 and Figure 7 show the temperature variation in (i) the upper part of the plate, (ii) the pipe outflow, and (iii) along the water pipe divided in sections, obtained from the CFD simulation.
Figure 5 shows the temperature variation in the upper part of the absorber plate for each of the different cross sections. The absorber plate with Type I cross section obtained a variation of 25 K, whilst the plates with Type II and Type III cross sections showed a variation of 19 and 22 K, respectively. This is because the fluid that flows through the pipe absorbs some of the heat from the absorber plate, which causes these temperature differentials.
Temperature distribution at the pipe outflow for the different sections is presented in Figure 6. The solar collector with the Type II cross section had the most uniform temperature distribution as it obtained a variation of only 15 K, followed by the Type III and Type I cross section, with a variation of 20 and of 22 K, respectively.
Figure 7 shows the temperature variation of the water along nine different sections of the pipe. The working fluid increases its temperature as it circulates through the pipe. In these three cases, the external part of each geometry presents the higher temperature due to this part is in direct contact with the inner part of the pipe, which permits to absorb greater amount of heat. The fluid into the Type I cross section got the highest temperatures among all of the three sections, reaching values up to 330 K at the pipe outflow.
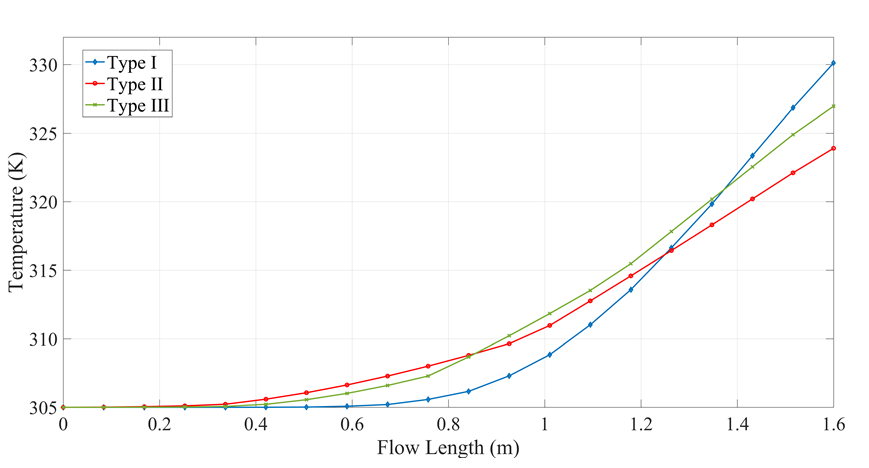
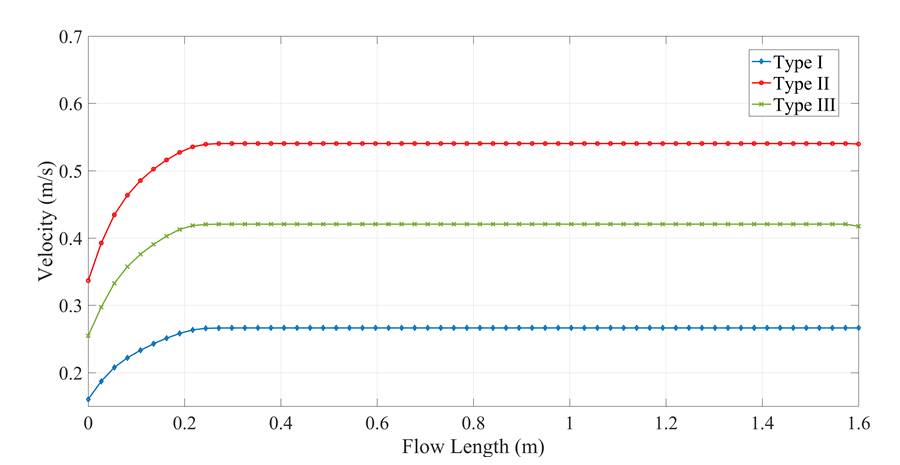
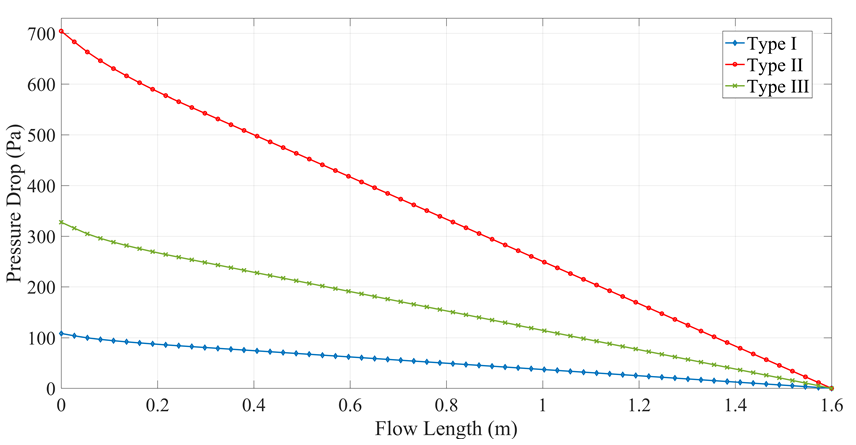
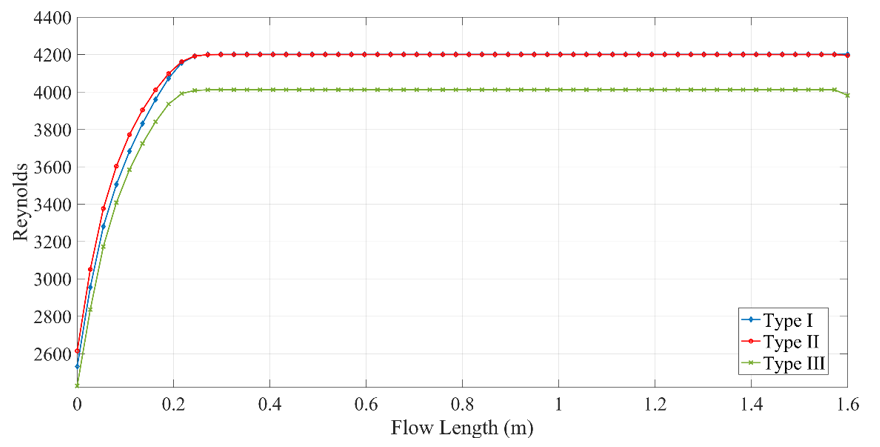
Figure 8 shows the temperature variation of water along the pipe. The collector with a Type I cross section had the best performance due to it presented the lowest speeds, as shown in Figure 10, which decreased the pressure drop (Figure 9) and improved the heat transfer from the environment to the fluid. Meanwhile, the collectors with Type II and Type III cross sections obtained maximum temperatures of 323.9 and 326.96 K, respectively. The variation of fluid speed also affects the Reynolds number (Figure 11). Type I and Type II present similar Reynolds number despite of their difference between their velocities and hydraulic diameters, obtaining a value of 4200, while Type III presents a Reynolds number of 4011.
The CFD results of the solar flat plate collector with different cross sections, simulated under the same operation conditions and in a steady state showed that the collector with the Type I cross section had the best performance, where the fluid reached temperatures up to 330 K at the pipe outflow and obtaining an efficiency of 68 %, higher than Type II and Type III, which presented efficiencies of 51 and 60 %, respectively. In addition, this cross section presented the lowest values in both speed and pressure differential, 0.266 m/s and 108.3 Pa respectively. However, the collector with the Type II cross section was the one that presented a more uniform temperature distribution at the pipe outflow, obtaining a variation of only 15 K, followed by the Type III and the Type I with a variation of 20 and 22 K, respectively.