
Journal Information
Title: Enfoque UTE
Editor-in-Chief: Diego Guffanti
Associate Editor: Víctor Suntaxi
Copyright: 2025, The Authors
Volume: 16 Issue: 3
ISSN (electronic): 1390-6542
Copyright statement: License (open-access,
https://creativecommons.org/licenses/by/4.0/)
Article Information
Date received: APRIL 16, 2025
Date accepted: JUNE 2, 2025
Publication date: JULY 1, 2025
Date of current version: JULY 1, 2025
Publisher: Universidad UTE (Quito, Ecuador)
Pages: 25-36
DOI: https://doi.org/10.29019/enfoqueute.1173
http://ingenieria.ute.edu.ec/enfoqueute/
Optimized Fairing Development for Electric Motorcycle Using CFD Simulation and Finite Element Analysis (FEA)
Martínez-Reategui Cristian H.1*, León-Japa Rogelio S.2, Jurado Francisco3
Abstract
The growth of urbanization has generated an increase in the use of motorized transport, which has intensified problems such as road congestion, environmental impact and health and safety risks. Currently, the automotive field is responsible for more than 10 % of global greenhouse gas (GHG) emissions. In response to this problem, manufacturers have developed several solutions, with electric vehicles playing the leading role as a sustainable alternative. Electric motorcycles have shown a growth in sales in recent years in Ecuador; however, their growth is limited by factors such as lack of infrastructure and government regulations. Manufacturers focus on aerodynamics as a key aspect to improve efficiency; to optimize their design, tools such as wind tunnels or computational simulations are used, the latter being a more accessible option. This study proposes the design of a fairing for an electric motorcycle using CAD/CAE software, based on the IDes process. Three proposals were developed, evaluating their aerodynamic performance under the conditions of Loja province. The results indicated that design 3 obtained the best performance, with an average drag coefficient of 0.283 and a lift coefficient of -0.273, subjected to different speeds. From the structural point of view, epoxy resin with unidirectional prepreg S-glass fiber was selected for its balance between mechanical properties and cost. The simulation showed a maximum deformation of 0.35339 mm under various stresses. Furthermore, in the modal analysis, at 78.802 Hz, the fairing presented a deformation of 15.788 mm with a maximum amplitude of 6.5 Hz, validating its ability to withstand the dynamic conditions of the motorcycle without compromising its structure.
Keywords
Electric motorcycle; Finite element; Computational fluid dynamics (CFD); Drag coefficient; Lift coefficient; Structure.
Resumen
El crecimiento de la urbanización ha generado un aumento en el uso de transporte motorizado, lo que ha intensificado problemas como la congestión vial, el impacto ambiental y riesgo en la salud y seguridad. Actualmente, el campo automotriz es responsable de más del 10 % de las emisiones globales de gases de efecto invernadero (GEI). Como respuesta a esta problemática, los fabricantes han desarrollado diversas soluciones, teniendo el papel principal los vehículos eléctricos como una alternativa sostenible. Las motocicletas eléctricas han mostrado un crecimiento en ventas en los últimos años en Ecuador; sin embargo, su crecimiento se ve limitado por factores como la falta de infraestructura y regulaciones gubernamentales. Los fabricantes se enfocan en la aerodinámica como un aspecto clave para mejorar la eficiencia, para optimizar su diseño, se emplean herramientas como túneles de viento o simulaciones computacionales, siendo este último una opción más accesible. Este estudio propone el diseño de una carenado para una motocicleta eléctrica utilizando software CAD/CAE como el SolidWorks para el diseño y el Ansys workbench para la simulación, basado en el proceso IDEs. Se desarrolló tres propuestas, evaluando su desempeño aerodinámico bajo las condiciones de la provincia de Loja. Los resultados indicaron que el diseño 3 obtuvo el mejor desempeño, con un coeficiente de arrastre promedio de 0.283 y una fuerza de sustentación de -0.273, sometido a distintas velocidades. Desde el punto de vista estructural, se seleccionó la resina epoxi con fibra de vidrio S preimpregnado unidireccional, por su equilibrio entre propiedades mecánicas y costo. La simulación determinó una deformación máxima de 0.35339 mm bajo diversos esfuerzos. Además, en el análisis modal, se halló 78.802 Hz, el carenado presentó una deformación de 15.788 mm con una amplitud máxima de 6.5 Hz, validando su capacidad para soportar las condiciones dinámicas de la motocicleta sin comprometer su estructura.
Palabras Clave
Motocicleta eléctrica; Elementos finitos; Dinámica de fluido computacional (CFD); Coeficiente de arrastre; Coeficiente de sustentación; Estructura.
I. INTRODUCTION
The growth of urbanization and the increase in motorization have posed significant challenges related to congestion, the environment, health, and safety [1]. In this context, electric vehicles have emerged as a key solution for more sustainable mobility, by reducing the impact of urban transportation on air quality, road traffic, and equitable access to transportation [2]. This is especially relevant, considering that the automotive sector is responsible for more than 10 % of global greenhouse gas (GHG) emissions and is one of the largest consumers of oil worldwide [3].
In vehicle design, aerodynamics plays a crucial role as it directly influences energy efficiency, performance, and safety. The use of numerical tools such as computational fluid dynamics (CFD) complements traditional wind tunnel testing [4], enabling the optimization of drag coefficient and aerodynamic load. These improvements positively impact maneuverability, structural stress, and energy consumption [5].
In Ecuador, despite the commercial growth of electric motorcycles—with a 5.4 % increase in sales compared to 2021 and a 37.2 % increase compared to 2019 [6]—challenges related to geography and limited range still persist. Manufacturers have developed solutions such as higher-capacity batteries and regenerative braking systems, but have also turned to less efficient alternatives like the incorporation of trailers [7]. Additionally, the lack of specific regulations has led to operational issues with electric motorcycles, prompting the Ecuadorian Transit Commission (CTE) to announce regulations to govern their use [8].
The objective of this research is to design a fairing prototype for an electric motorcycle using computer-aided engineering (CAE) tools. Based on an existing chassis structure, the project aims to develop a design that integrates aerodynamic and structural parameters, optimizing performance through specialized software such as SolidWorks for CAD modeling and Ansys for aerodynamic simulations. Various proposals will be evaluated to select the most efficient design.
The methodology combines the IDeS approach (Industrial Design Structure) with Stylistic Design Engineering (SDE), integrating aesthetic and functional principles [9]. This enables the development of preliminary designs tailored to local needs and the comparison of alternatives to identify the best option in terms of energy efficiency and structural performance.
A recent study analyzes the charging infrastructure for electric vehicles along the Cuenca-Loja route, identifying fourteen optimal locations for charging stations [10]. In line with this finding, this project proposes a conceptual fairing design that optimizes energy consumption, reduces reliance on charging stations, and minimizes implementation costs by maximizing the aerodynamic and structural properties of the fairing.
The optimized fairing design for the electric motorcycle, developed at the Universidad Nacional de Loja (UNL), emerges as a comprehensive response to the challenges of energy efficiency and limited range faced by these vehicles, particularly in Ecuador’s geographic and urban context. Considering the country’s topographical conditions and the growing demand for sustainable mobility solutions, the project focuses on reducing aerodynamic drag through a design adapted to the local environment. This initiative not only significantly enhances the vehicle’s performance and range but also contributes meaningfully to national technological innovation, promoting the adoption of electromobility as a viable, accessible, and environmentally responsible alternative.
II. METHODOLOGY
A. Specific Fairing Requirements
The MotoStudent regulations specify the design and accessory requirements for the fairing. All edges must be rounded with a minimum radius of approximately 1 mm. This measure not only aims to prevent cuts when handling the fairing—whether during removal or installation—but also to protect the rider from potential injuries in case of an accident. These specifications ensure that the design is safe for both daily use and unforeseen situations, prioritizing ergonomics and user safety [11].
The minimum and maximum dimensions of the motorcycle must comply with certain parameters. The minimum distance between the ends of the clip-on handlebars must be approximately 450 mm. Additionally, the motorcycle must allow a minimum lean angle of 50° without any part touching the ground. The seat must have a width of 450 mm and must not exceed a maximum width of approximately 600 mm at the front. On the other hand, the ground clearance in an upright position must be at least 100 mm when the motorcycle is stationary. Finally, the maximum permitted height from the seat to the highest part of the tail section will be approximately 150 mm. All of these parameters are better illustrated in Figure 1. [12]
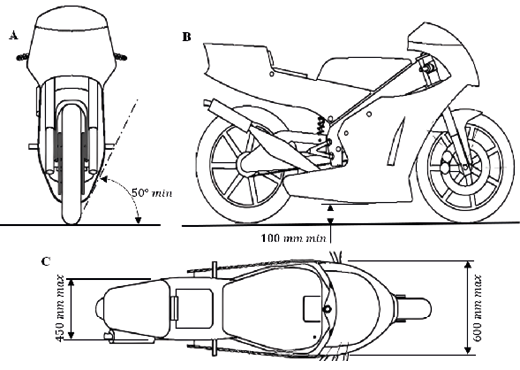
Fig. 1. Motorcycle design parameters.
B. Fairing Sketch Design
A market study was conducted on different types of urban designs with the aim of identifying various detail lines in correlation with the IDeS methodology [9]. As part of the initial stage of the manufacturing process, hand-drawn sketches were developed to select the most suitable design [13] (see Figure 2). This process considered elements that cannot be modified, based on previous studies of the frame and its dynamics. Additionally, existing auxiliary components were evaluated, such as the front headlight, which features an external round-shaped design concept.
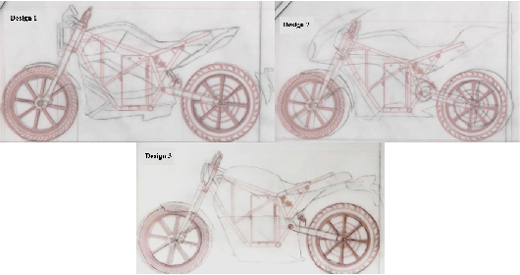
Fig. 2. Most suitable final designs with easy adaptability for modification.
C. CAD Designs of the Fairing Models
Using SolidWorks software, detailed conceptual designs were developed with the use of surface modeling tools, as shown in Figure 3. In the development of complex parts, this process is essential. The modeling process varies greatly from person to person, as there is no strictly right or wrong way to model—some approaches involve more operations, while others use fewer. However, fewer operations do not always mean a better model, as this can affect the flexibility for making design changes if needed [14].
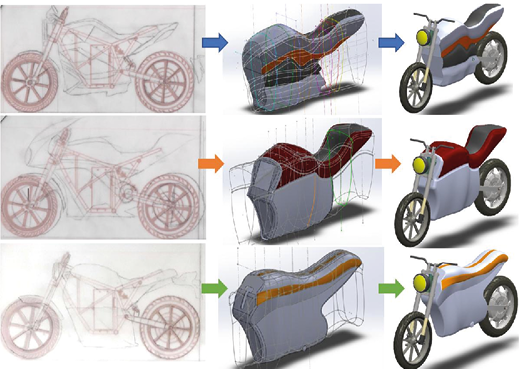
Fig. 3. Modeling of the highlighted designs.
D. Aerodynamic Analysis of the Fairing Using CFD
The aerodynamic analysis is carried out using Ansys’ CFD simulation library within the Fluid Flow (CFX) module. As a first step, a Boolean operation is created to generate a cavity by subtracting the target body from the general body in order to remove the intersection zone, as shown in Figure 4.
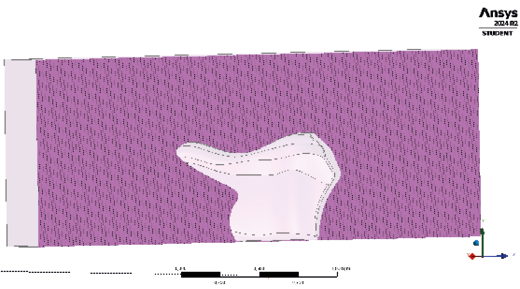
Fig. 4. Fairing removal from the control volume.
As for external parameters, the average temperature in the city of Loja—where the electric motorcycle will operate—is approximately 24°C. This value is also used to estimate air density based on the standards defined in ISO 2533:1975, as shown in Equation 1 [15].
(1)
Where represents the atmospheric pressure in the city of Loja in , R is the universal gas constant with a value of 8.314472 in , is the molar mass of dry air, equal to 0.02896351244 , and T corresponds to the average ambient temperature in Loja expressed in [K].
Meshing involves dividing the geometry of the model into small parts known as finite elements, breaking the model into more manageable pieces that facilitate computational calculation (see Figure 5).
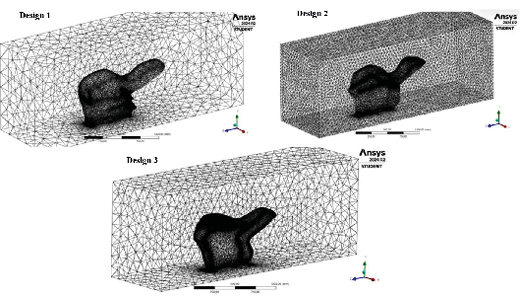
Fig. 5. Meshing of the fairing control volume
During mesh creation, it is recommended to maintain a maximum skewness ratio below 0.95 to ensure proper mesh quality [16]. According to this criterion, a skewness ratio between 0 and 0.25 is considered excellent; between 0.25 and 0.50, very good; from 0.50 to 0.80, good; from 0.80 to 0.94, acceptable; from 0.95 to 0.97, poor; and between 0.98 and 1.00, unacceptable [17]. These mesh quality ranges are detailed more clearly in Table I.
Orthogonal quality is another parameter that measures mesh quality. The minimum acceptable orthogonal quality index is below 0.1 [16]. In this case, the model meets the requirement with a minimum index of 0.17. Additionally, values between 0.95 and 1.00 are considered perfect mesh quality [17], as shown in Table I.
TABLE I. STANDARD VALUES FOR MESH QUALITY PARAMETERS REGARDING ASPECT RATIO AND SKEWNESS
|
Parameters |
Standard Values |
||||||
|
Aspect Ratio |
0.2 – 0.5 Equilateral |
Excellent |
Very Good |
Good |
Acceptable |
Poor |
Unacceptable |
|
Skewness |
0 |
0 – 0.25 |
0.25 - 0.50 |
0.50 - 0.75 |
0.75 - 0.90 |
0.90 - < 1 |
1 |
|
Orthogonal Quality |
- |
0.95 – 1 |
0.70 - 0.95 |
0.20 - 0.69 |
0.10 - 0.20 |
0.001 - 0.10 |
0 - 0.001 |
|
|
|
|
|
|
|
|
|
Turbulence models are essential numerical tools that allow the linkage of average fluctuations with mean values of variables, thus facilitating the resolution of equations that describe turbulent fluid behavior. These models are widely applied in CFD analysis programs and include a variety of approaches such as algebraic, , and [18].
The model is preferred due to its specific advantages in aerodynamic and turbomachinery simulations [19] [20]. The model is known for its accuracy in calculating flows near solid surfaces and its adaptability to a wide range of flow conditions. Its selection is also based on the computational limitations imposed by the student license of Ansys, which restricts the number of nodes and elements used in CFD analysis [16].
E. Material Selection Method
The most suitable material for the construction of the fairing is considered to be composite materials due to their numerous advantages and properties. These materials are widely used in the transportation industry thanks to their combination of lightness, stiffness, and high impact resistance. Additionally, they stand out for their durability, offering excellent resistance to corrosion and wear, making them an ideal option for demanding applications [21].
An optimal material selection should be based on the evaluation of essential properties, among which tensile strength and economic feasibility of the material are highlighted, ensuring that its acquisition cost is affordable. Furthermore, it is important to consider the manufacturing process, as some composite materials present complexities that require highly skilled personnel for proper handling and the production of special parts, such as auto parts [22].
The fairing fulfills a crucial function, as it optimizes the aerodynamics of the assembly. The main objectives of the selection were to reduce the total weight of the fairing, which initially was 4.32 kg, while ensuring that the structural strength was not compromised. Key constraints that the material had to meet were established, such as impact and vibration resistance, corrosion and fatigue resistance, as well as ease of manufacturing and a reasonable cost. Within the selection process, the fiber type, polymer matrix, fiber orientation, and fiber content in the composite structure were defined as free variables.
The performance index table provided by the CES Edupack software was used, a tool that allows comparison and classification of materials according to their mechanical and physical properties. To create the Ashby diagram, a key constraint was applied that requires a minimum strength with the lowest possible mass, aiming to reduce the initial weight of the fairing without compromising its structural integrity. To select the optimal materials for manufacturing the fairing, an analysis was carried out based on the relationship between acquisition cost and mechanical strength. The goal was to identify materials that offered a balance between high structural performance, low cost, and ease of manufacturing, as illustrated in Figure 6.
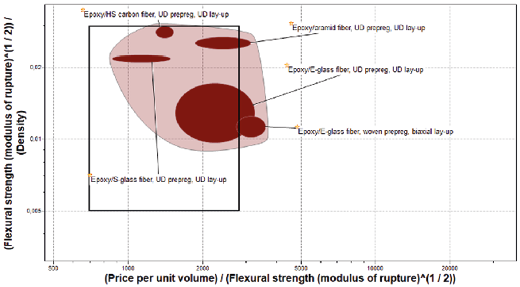
Fig. 6. Results of selected materials in CES Edupack Software.
Two evaluation methods were used for the material selection. The first is based on a decision matrix, in which the obtained values are normalized using the most relevant results as a reference. Then, a weighting is assigned to each result based on the total value of each evaluated criterion on a scale from 1 to 10. Finally, a summation is performed to determine the material with the best performance, considering cost optimization and the maximization of mechanical properties.
The second evaluation method used is the Analytical Hierarchy Process (AHP), a methodology that facilitates the selection of alternatives through the comparison of a series of criteria or variables organized in a hierarchical structure. In this approach, the top level represents the main objective, while the criteria and sub-criteria are distributed across lower levels. Since these criteria often conflict, AHP allows priorities to be established and the best option to be determined. This method is based on the use of a pairwise comparison scale [23]. This approach is especially effective due to the human brain’s natural ability to evaluate and compare two criteria or alternatives at a time, thus facilitating decision-making. However, when it is necessary to compare multiple options simultaneously, the complexity of the analysis increases considerably, which can generate uncertainty and hinder optimal choice [23].
The use of Expert Choice software requires entering detailed descriptions of each criterion and sub-criterion of analysis, as shown in Figure 7. This is essential for properly structuring the decision model, as it allows organizing and prioritizing the determining factors in the selection of the most suitable material.
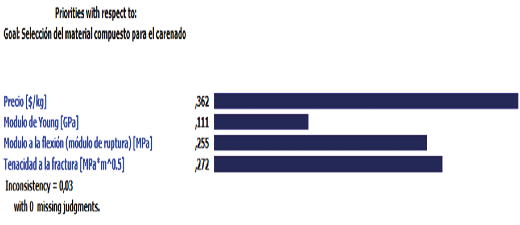
Fig. 7. Valuation criteria for material selection.
F. Structural Method for Fairing Analysis
The structural simulation begins with the preparation of the CAD designs generated in SolidWorks for analysis in Ansys, using the Workbench module. A compatible format is used to allow a smooth transition between both software environments. Subsequently, solid elements were converted into surface sheets using the SpaceClaim interface.
For meshing, a methodology based on mesh convergence was employed, which consists of identifying the optimal mesh resolution to ensure accurate and reliable results in simulations. This directly affects the number of vertices, as it controls both the expansion and the allowed element size in critical regions, establishing a resolution from 0.02 to 5 % [24]. The convergence rate (Tc) is equal to the difference between the latest and previous stress results, divided by the previous stress result, as described in Equation 2:
(2)
This approach not only ensures higher accuracy in aerodynamic or structural simulations, but also optimizes computational performance by balancing the mesh density in key areas of the analysis, as demonstrated in Figure 8.
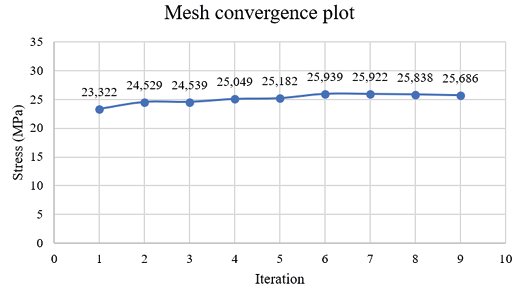
Fig. 8. Valuation criteria for material selection.
For refinement, a quadrilateral mesh was implemented to study a 2D surface-type mesh, which improved the quality of the analysis [25]. A mesh thickness of 8 mm was established, while in critical areas a refinement was applied with a reduced thickness of 5.5 mm, as illustrated in Figure 9. This adjustment was made to improve the representation of stress and strain gradients, ensuring greater fidelity in the results. The validity of this approach was verified through an iterative process, whose results are presented in Figure 8, confirming that the refinement improves convergence without oversaturating the fairing with excessive mesh density.
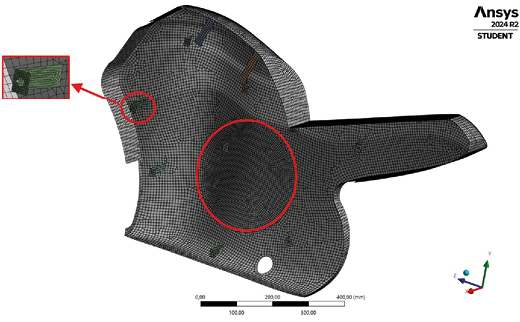
Fig. 9. Mesh refinement in the deformation zone.
The predetermined material thickness was set at 3 mm, defined based on an evaluation of its mechanical properties to ensure its capacity for impact absorption and structural resistance [18]. The design must withstand both the loads generated by the weight of the motorcycle itself, which includes the motor, controller, and battery, as well as the weight of a person, totaling 162.2 kg, in accordance with the manufacturer’s manual [26]. Additionally, it must resist external forces without compromising structural integrity. In this way, the durability of the rider’s fairing is ensured, even under operational conditions, as defined in Equation 3:
(3)
III. RESULTS AND DISCUSSION
A. Preliminary Design Results
The design process was based on the Industrial Design Structure (IDes) approach, integrating tools such as Quality Function Deployment (QFD) and Stylistic Design Engineering (SDE), which optimize efficiency in product development. Technologies such as Augmented Reality (AR) and Additive Manufacturing (AM) allow real-time visualization of the models, facilitating early detection of improvements in the fairing structure [9].
The fairing design was also adapted to the guidelines of the MotoStudent 2018 regulation, which establishes key requirements for vehicle safety and functionality. The minimum edge radius of 1 mm was respected, and designs that laterally covered the rider were avoided to minimize risks in the event of a fall. Additionally, the minimum lateral tilt angle of 50° was met, ensuring that no part of the fairing interferes with the frame. Dimensional constraints were also respected, such as a maximum width of 600 mm and a minimum ground clearance of 100 mm, resulting in designs like the one shown in Figure 10.
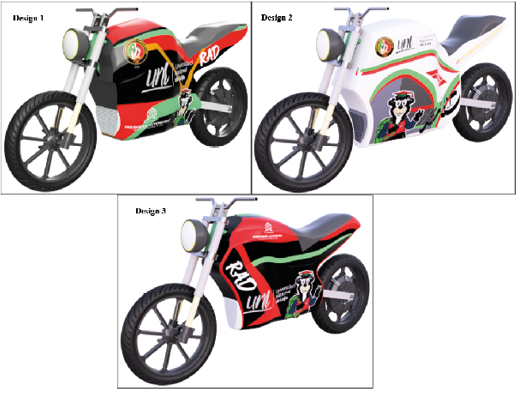
Fig. 10. Rendering of the fairing designs.
B. CFD Methodology Results
From an aerodynamic standpoint, three fairing configurations were analyzed, with drag coefficients of 0.367, 0.468, and 0.282, the latter being selected due to its better performance, as shown in Table II. In other studies, where coefficients range between 0.5915 and 0.7629, a significant reduction in air resistance is observed [27]. Another study reports values of 0.32 and 0.36 in prototype designs for the Shell Eco Marathon competition, reinforcing the validity of the results of this research. Additionally, the obtained lift forces were -0.317, -0.11, and -0.273 [28], showing correlation with previous studies and confirming the aerodynamic stability of the design.
TABLE II. MESH RESOLUTION AND ASPECT RATIO METRICS
|
Aspects |
Design 1 |
Design 2 |
Design 3 |
|
|
Nodes |
81720 |
102392 |
205000 |
|
|
Elements |
437487 |
548708 |
1115586 |
|
|
Frontal area (m²) |
0.27 |
0.3 |
0.19 |
|
|
Skewness metric |
0.23743 |
0.23265 |
0.23311 |
|
|
Orthogonal quality |
0.76127/p> |
0.7661 |
0.76563 |
|
|
Fluid temperature |
25°C |
|||
|
Reference pressure |
101220 Pa |
|||
|
Turbulence model |
k-epsilon |
|||
|
Element type |
Tetrahedral |
|||
|
Minimum speed |
45 km/h |
|||
|
Maximum speed |
150 km/h |
|||
|
|
|
In Design 1, a slight pressure increase was detected on the lateral side of the fairing, especially in the area where the motorcycle seat mount is located. This behavior indicates a potential interaction point between the airflow and the fairing structure in that region. In Design 2, a pressure concentration was observed in the tail section, within a well-defined area of approximately 150 mm. In contrast, Design 3 showed a significantly different behavior. In this model, the pressures on the fairing body were considerably lower, and air fluctuations on the lateral areas remained minimal. This favorable aerodynamic behavior reduces disturbing forces on the fairing, granting it important advantages in terms of stability and aerodynamic efficiency, positioning it as a strong candidate in the optimal design selection process.
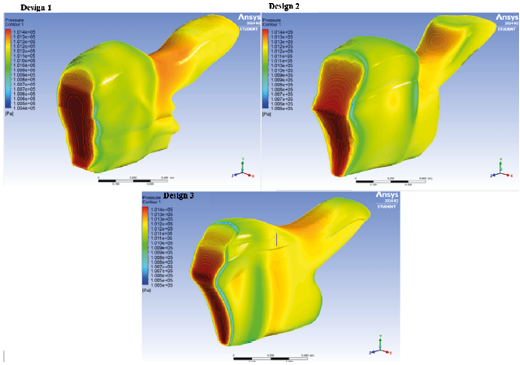
Fig. 11. Pressure map of the three fairing designs.
One of the most relevant aspects analyzed in the simulations was the airflow behavior inside the fairing, including fluctuations and effects from its interaction with ventilation grids designed to facilitate air intake and exhaust. Design 3 showed outstanding results regarding well-distributed and efficient internal airflow, with an adequate exit of hot air through the ventilation outlets. This behavior not only ensures better thermal control by maintaining optimal internal temperatures, but also minimizes internal airflow fluctuations, enhancing the aerodynamic stability of the fairing.
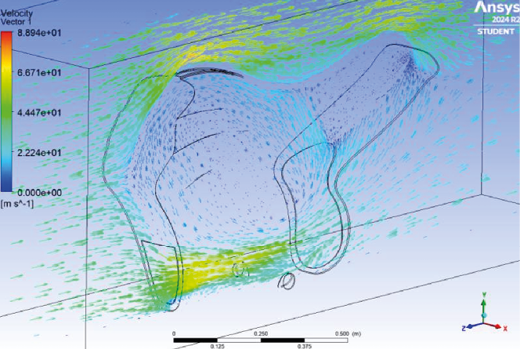
Fig. 12. Internal airflow of the fairing for Design 3.
To determine the drag and lift coefficients using Ansys software, specifically in the CFX library, the drag force value was initially obtained in order to analytically calculate the corresponding coefficients. The drag coefficient was calculated for speeds of 45, 65, and 150 km/h, starting from the drag force equation.
(4)
For the lift coefficient, a mathematical model was applied starting from the lift force, which is the component perpendicular to the airflow acting on the fairing, considering air density, the frontal area of the fairing, and the speeds defined in the study.
(5)
Turbulence formation was also observed in the rear zone, specifically around the rear tire. These 2D streamlines have a direct impact on the motorcycle’s aerodynamics, as their continuity promotes reduced aerodynamic drag and improved stability. The effect is more evident in Designs 1 and 2, as seen in Figure 13, where flow disturbances are more pronounced. On the other hand, Design 3 shows a significant reduction in turbulence formation, suggesting improved aerodynamic performance of the fairing and reduced drag.
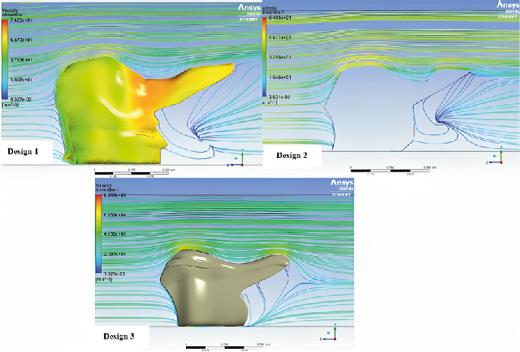
Fig. 13. Streamlines in the models.
C. Aerodynamic Boundary Layer
The boundary layer is a thin region of fluid flow, such as air, that develops parallel to solid surfaces, in this case, the fairing wall [29]. In order to minimize additional mass on the chassis and preserve the rolling efficiency of the motorcycle, the use of composite materials for its construction is foreseen. Likewise, restrictions on the use of original accessories are considered to avoid increases in manufacturing costs.
With the development of computational capabilities in recent decades, it has become possible to numerically solve the Navier-Stokes equation in flows with complex geometries. This has revolutionized fluid analysis, eliminating the need to separate the flow into outer zones and boundary layer regions, since the use of CFD now allows solving all the equations of motion throughout the entire flow field [29], as shown in Figure 14.
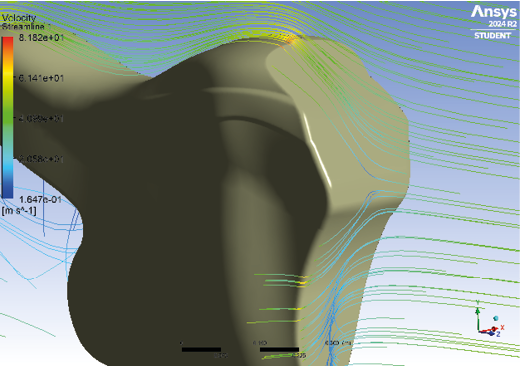
Fig. 14. Effect of the boundary layer on the fairing.
To begin the analysis, it is essential to understand the behavior of the air over the fairing. This is achieved by calculating the Reynolds number (Re), using equation 6. This value allows determining whether the flow is laminar or turbulent, which is key to properly approximating the boundary layer. According to established criteria, the flow is considered laminar if the Reynolds number is less than 5 • 105 and turbulent if it is greater [29]. This calculation uses the different velocities at which the motorcycle will travel (V) in meters per second [m/s], the length of the fairing from the leading edge to its rear end (L) in meters [m], and the kinematic viscosity of air (v), whose average value is approximately 1.5 • 10-5 [m2/s].
(6)
The boundary layer thickness (δ) is defined as the distance from the wall to the point where the parallel velocity reaches 99 % of the fluid velocity outside the layer. For its calculation, the formulation for turbulent flow was used, since the Reynolds number exceeded the limit for laminar flow. These values allow the use of three significant figures due to their higher precision; in turbulent regime, two significant figures were chosen due to the high characteristic uncertainty. To describe the flow properties, two approaches were considered: the one-seventh power law and a variant that incorporates empirical data for smooth surfaces [29], as described in Table III, with the latter being the option selected for the calculations.
TABLE III. COMPARISON OF LAMINAR AND TURBULENT BOUNDARY LAYER PROPERTIES
|
Property |
Laminar |
Turbulent(1) |
Turbulent(2) |
|
Boundary Layer Thickness |
|
|
|
|
Displacement Thickness |
|
|
|
|
Momentum Thickness |
|
|
|
|
Local Friction Coefficient |
|
|
|
For better understanding, the graph 15 has been created to demonstrate the theory mentioned by [29], which states that at a given position x, the higher the Reynolds number, the thinner the boundary layer will be, with everything else remaining constant, and the boundary layer approximation becomes more reliable.
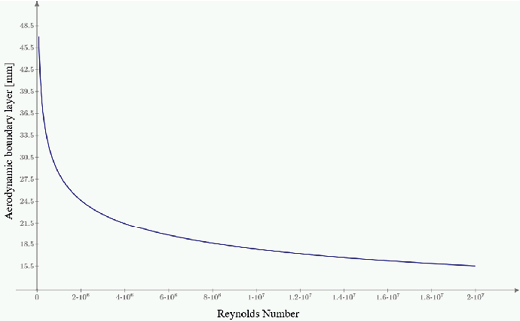
Fig. 15. Reynolds number Vs Boundary layer.
The analysis of turbulent flow around the fairing was carried out using Ansys software, selecting design 3 to evaluate the entire surface exposed to the wind tunnel. The solution converges by applying the continuity equation. The residuals of kinetic energy and turbulent dissipation, shown in figure 16, stabilize around 1.0e-03, an acceptable value that does not compromise aerodynamic drag, showing behavior similar to studies on laboratory turbomachinery [30]. This interaction helps reduce resistance on objects and reveals vortex formation [31]. Aerodynamic simulations show that controlling the flow improves vehicle efficiency [32] [33]. In motorcycles, this control also promotes more stable riding and lower energy consumption.
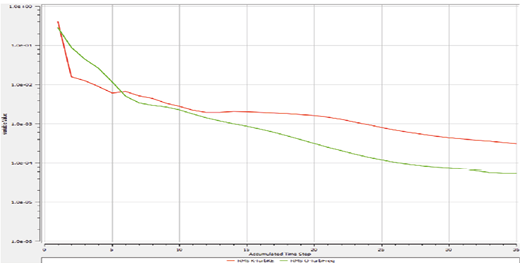
Fig. 16. Turbulent kinetic energy and dissipation.
D. Material Selection Result
The best alternative was unidirectionally pre-impregnated S-glass fiber with epoxy resin, obtaining a score of 8.22 in the weighting analysis, following a methodology similar to the one used by [34]. In addition, the selection was validated using the Expert Choice software, where this material achieved the best result with 38.7 % and an inconsistency ratio of 0.03 (see Figure 17), which correlates with the study conducted by [34].
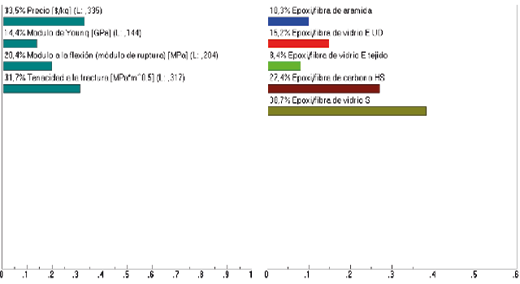
Fig. 17. Result of the most optimal material in Expert Choice.
The results obtained with the Expert Choice software confirm that epoxy/S-glass fiber is the best option due to its high selection percentage and lower cost compared to other alternatives. While carbon fiber presents better properties in terms of Young’s modulus and flexural modulus, epoxy/S-glass fiber stands out for its higher fracture toughness, making it a more balanced alternative when considering both mechanical properties and economic feasibility, as shown in Figure 18. This type of methodology was used by replicating the use of similar studies such as that of [35], for the design and construction of uprights and wheel hubs of an electric Formula SAE competition vehicle, using the decision matrix methodology and implementing a validation with the AHP hierarchical method used in the study of [34] for the selection of a type of composite material according to the intended use.
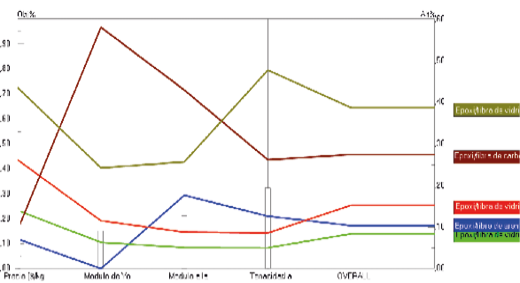
Fig. 18. Result by each criterion in Expert Choice.
E. Structural Simulation Results
The fairing was designed with a thickness of 3 mm, achieving a maximum deformation of 0.35339 mm under a load of 2100 N, which is higher than the combined weight of the motorcycle accessories. Another study reported a deformation of 8.43 mm under different loading scenarios, highlighting the greater stiffness of the fairing developed in the present work [18]. To ensure result accuracy, the mesh was adjusted within a resolution range between 0.02 and 5 % [24]. A total of 9 iterations were performed. In this process, 16,153 nodes and 16,071 elements were generated, achieving a Quality ratio of 0.98512, indicating high mesh quality, as shown in Figure 19, which ensured convergence without compromising computational efficiency.
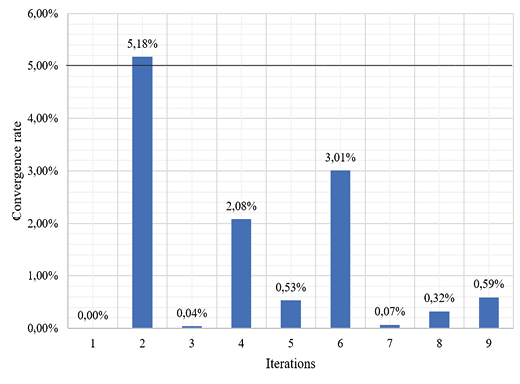
Fig. 19. Iteration diagram vs. convergence rate analysis.
Both aerodynamic forces and the total weight of the mounted accessories were considered in the event of a crash. Additionally, high forces were simulated to replicate impact conditions and analyze the material’s response under extreme scenarios. Significant deformation was observed in the area where the rider’s legs are positioned, along with minor deformations in other regions. However, the latter can be considered negligible, as no excessive stresses are generated in these regions under normal operating conditions.
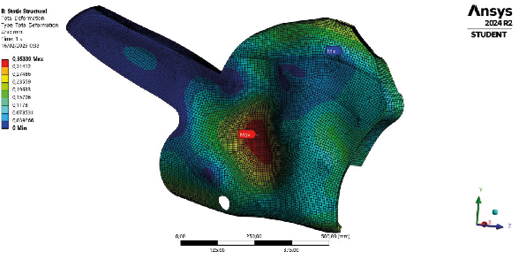
Fig. 20. Deformation zones of the fairing.
Multiple simulations were conducted to evaluate the material behavior under various loading conditions. As shown in Figure 21, the first two stress cases analyzed correspond to aerodynamic forces generated at speeds of 45 km/h and 65 km/h. Subsequently, at a speed of 150 km/h, the applied force reached 297.8620 N. From this point, predefined loads were applied to assess material deformation. The results indicate that, under a load of approximately 2100 N, the deformation factor obtained was 0.35339 mm, showing an exponential increase in deformation. This analysis helps determine the material’s reliability and its ability to withstand high structural demands.
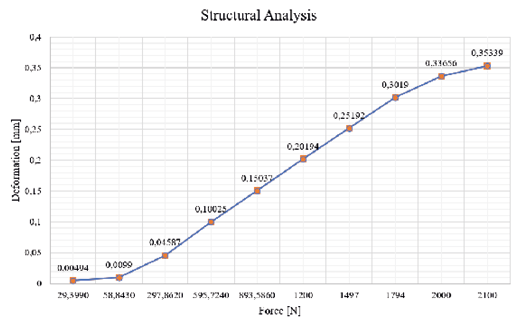
Fig. 21. Force vs. Deformation diagram.
The Von Mises criterion was used to evaluate load distribution in the fairing. As observed in Figure 22, a higher stress concentration was identified at support point B, located at the bottom of the fairing, specifically in the area where the rider places their feet. This result is consistent with the observations in Figure 22, suggesting that this area is particularly susceptible to mechanical stress due to the load it bears and the vibrations generated during motorcycle operation.
The onset of stress occurs with a force of 58.8430 N, corresponding to a speed of 65 km/h, with an equivalent stress of 1.5207 MPa. At this stage, stress distribution remains low and does not significantly impact the structure. However, as the applied load increases, stress progressively grows, showing an upward trend in the material’s response to the imposed loading conditions.
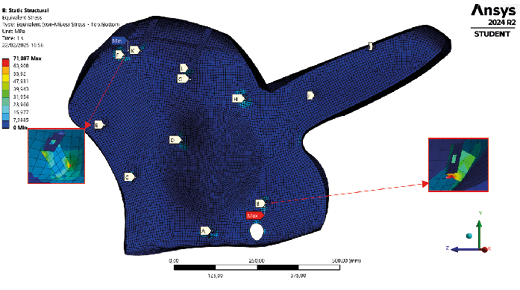
Fig. 22. Deformation stress, Von Mises criterion.
By analyzing the reaction forces at different fairing anchorage points, it was found that one of these points exhibited a significantly higher reaction compared to the others. This behavior is explained by its proximity to an area of the fairing where lateral deformation occurs. The presence of this deformation indicates a stress concentration in that specific area, allowing for an evaluation of the effectiveness of the supports used, as illustrated in Figure 23. These supports play a crucial role in distributing the loads, demonstrating their capability to prevent failures at the most critical anchorage points. Thanks to this proper load distribution, potential breakage or crack formation in the fairing is prevented, thus ensuring its structural integrity and extending its service life.
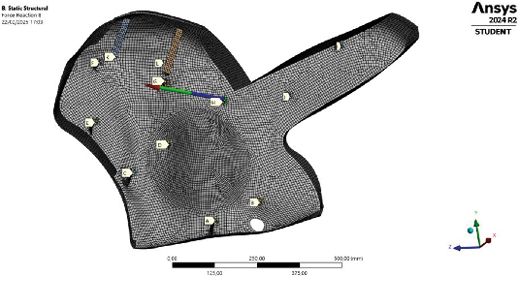
Fig. 23. Fairing reaction force distribution diagram.
F. Modal Simulation Results
The results obtained in Ansys Modal allow for the analysis of the natural frequencies and the maximum deformation of the motorcycle fairing. The simulation reveals a total of 6 vibration modes, showing displacements in the three Cartesian axes, as described in Table IV. Additionally, in the final vibration mode, a dual action is observed on the X-axis, indicating a greater influence of this axis on the dynamic behavior of the fairing.
TABLE IV. NATURAL FREQUENCY, MAXIMUM DEFORMATION AND NATURE OF FAIRING DISPLACEMENT
|
Mode |
Natural Frequency [Hz] |
Maximum. Deformation [mm] |
Nature of displacement |
|
1 |
42.194 |
31.371 |
Bending along Y-axis |
|
2 |
54.703 |
25.653 |
Curving along Z-axis |
|
3 |
60.425 |
28.566 |
Curving along Z-axis |
|
4 |
61.924 |
44.787 |
Curving along X-axis |
|
5 |
69.393 |
30.851 |
Twisting along X-axis |
|
6 |
78.022 |
15.788 |
Twisting and bending along X-axis |
|
|
|
|
|
Complementing the data in Table IV, Figure 24 visually illustrates the different ways the structure deforms when subjected to various natural frequencies. Through this schematic representation, it is possible to analyze the behavior of the fairing under different vibration conditions, allowing for the identification of deformation patterns.
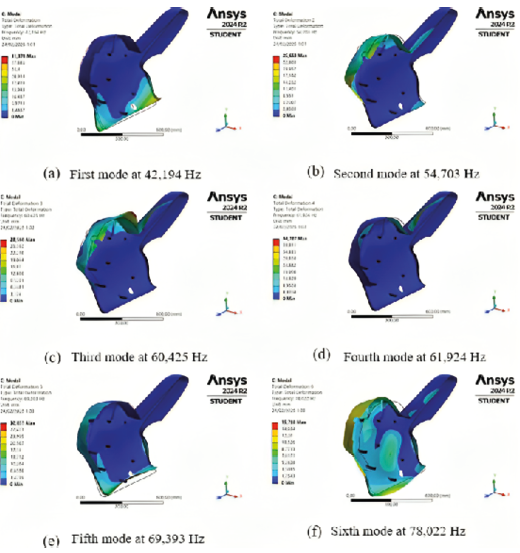
Fig. 24. Modal displacement shapes of the fairing.
In the modal analysis, the highest recorded deformation reaches a value of 44.787 mm, corresponding to mode 4, which has a frequency of approximately 61.924 Hz. On the other hand, the minimum deformation observed is 15.78 mm, associated with the last mode, with a frequency of 78.022 Hz—values within the range of 65 Hz to 135 Hz established for internal combustion motorcycles [36], adapted here for electric motorcycle conditions.
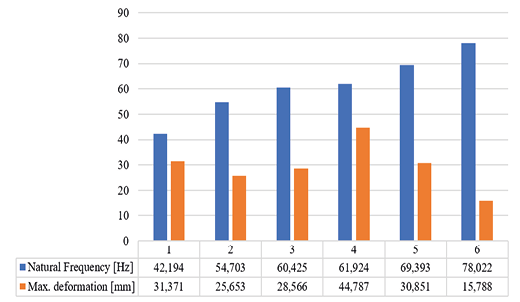
Fig. 25. Comparison of natural frequency and maximum deformation.
In the harmonic analysis, shown in Figure 26, the deformation of the fairing along the X, Y, and Z axes is presented, each with distinct behavior. The maximum amplitude recorded is 4.0105 mm at a frequency of 6.5 Hz in the Y and Z axes, while for the X-axis, the maximum amplitude reaches 2.3558 mm at the same frequency. As the frequency increases, a progressive decrease in deformation amplitude is observed. In the X-axis, deformation decreases to 0.14686 mm at a frequency of 13 Hz. Meanwhile, the Y and Z axes also show a downward trend, reaching an equal value of 0.26355 mm at a frequency of 26 Hz.
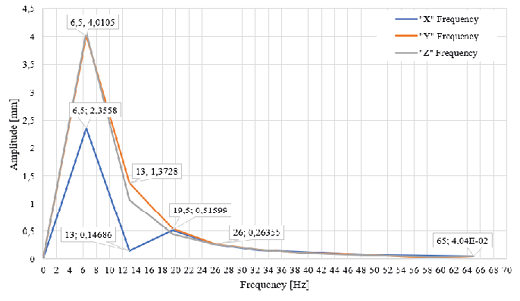
Fig. 26. Graphical comparison of frequency and amplitude.
IV. CONCLUSIONS
First, for the development of the designs, the Industrial Design Structure (IDes) methodology was key to analyzing current trends in motorcycle design to have an initiative with the initial sketches and CAD models. This allowed defining the fairing’s aesthetics with its own identity. Considering the guidelines of the MotoStudents Regulations, which helped delimit key aspects such as external dimensions and edge thickness, enabling the creation of a functional and aerodynamic fairing criterion.
In the selection of the most efficient design, priority was given to reducing drag resistance and lift. Design 3 obtained the best results, with a drag coefficient of 0.282 and a lift coefficient of -0.273. These values were validated through a meshing analysis that yielded a skewness of 0.23 (rated as excellent) and an orthogonal aspect ratio of 0.76 (very good). Additionally, the airflow around the fairing prevents vortex formation at the outlet, which could affect the motorcycle’s stability, and inside, a balanced flow is achieved, promoting better heat exchange.
The best material option is epoxy resin with S-type pre-impregnated unidirectional fiberglass, with a thickness of 3 mm. In the structural simulation, this material showed a deformation of 0.35339 under a force of 2100 N, confirming its resistivity. The validation demonstrates that a balanced mesh was achieved by the ninth iteration, remaining within the range of 0.02 to 5%, allowing to avoid unnecessary computational resource expenses.
The modal analysis allowed studying the fairing’s behavior under vibrations. It was identified that the most impactful frequency is 78.022 Hz, with a total deformation of 15.788 mm. A maximum amplitude of 6.5 Hz was also observed in the X and Y axes, indicating that the fairing can withstand the motorcycle’s dynamic conditions without compromising its structure.
Notas
* Corresponding autor: cristian.martinez@unl.edu.ec
1. Ing. Martínez Reategui Cristian Humberto, Facultad de Energía, Industrias y Recursos Naturales No Renovables, Universidad Nacional de Loja, Loja, Ecuador. E-mail: cristian.martinez@unl.edu.ec, ORCID number https://orcid.org/0009-0000-8639-9662
2. Ing. León Japa Rogelio Santiago Mg. Sc., Facultad de Energía, Industrias y Recursos Naturales No Renovables, Universidad Nacional de Loja, Loja, Ecuador. E-mail: rogelio.leon@unl.edu.ec. ORCID number https://orcid.org/0000-0003-2142-3769
3. Ing. Jurado Francisco Ph.D., Departamento de Ingeniería Eléctrica, Universidad de Jaén, Jaén, España. E-mail: fjurado@ujaen.es. ORCID number https://orcid.org/0000-0001-8122-7415.
REFERENCES
[1] M. T. Folgôa, C. Grande, C. Vásquez, L. Suárez, L. M. Navas, R. Ramirez, R. Pérez, R. Andara, and C. Fajarta, “Ide y movilidad sostenible: Estado del arte en iberoamérica,” Universidade de Évora, p. 14, 2022. [Online]. Available: http://hdl.handle.net/10174/35665
[2] D. Moser, Ed., Movilidad eléctrica sostenible: Componentes esenciales y recomendaciones de políticas, 2021. [Online]. Available: https://www.sum4all.org/data/files/buildingblocksandpolicyrecommendations_spanish.pdf
[3] L. Abarca and L. J. Choque, “Estado actual de los impactos ambientales producidos por actividades del sector automotriz en latinoamérica, revisión sistemática de los últimos 10 años,” Ph.D. dissertation, Universidad César Vallejo, Ubicación, 2022, sistemas de Gestión Ambiental. [Online]. Available: https://repositorio.ucv.edu.pe/handle/20.500.12692/110424
[4] K. Wiński and A. Piechna, “Comprehensive cfd aerodynamic simulation of a sport motorcycle,” Energies, vol. 15, no. 16, p. 27, 2022. [Online]. https://doi.org/10.3390/en15165920
[5] F. Concli, M. Gobbi, and C. Gorla, “Aerodynamic study of motorcycle racing wheels: A performance evaluation based on numerical cfd simulations,” International Journal of Computational Methods and Experimental Measurements, vol. 7, no. 3, pp. 275-284, 2019. [Online]. https://doi.org/10.2495/CMEM-V7-N3-275-284
[6] A. de Empresas Automotrices del Ecuador, Ed., Anuarios 2023, 2023. [Online]. Available: https://www.aeade.net/anuario/
[7] J. Trujillo and L. Joseph, “Diseño aerodinámico del carenado de una motocicleta eléctrica fabricada en la usiek,” Ph.D. dissertation, Universidad Internacional SEK, Ubicación, 2022, mecánica Automotriz. [Online]. Available: https://repositorio.uisek.edu.ec/handle/123456789/4886
[8] K. Puga S., “Tant trabaja en reglamento para regular motos eléctricas y scooters en ecuador,” El Comercio, Dec 2024. [Online]. Available: https://www.elcomercio.com/actualidad/ecuador/ant-reglamento-regulacion-motos-scooter.html
[9] L. Frizziero, C. Leon, G. Galiè, G. Alessandri, L. Iannarelli, L. Lucci, S. Merighi, and P. Polignano, “Ides method applied to an innovative motorbike–applying topology optimization and augmented reality,” Inventions, vol. 7, no. 4, 2022. [Online]. https://doi.org/10.3390/inventions7040091.
[10] E. Méndez, I. Coronel Villavicencio, E. Pacha Herrera, B. Briceño Martínez, E. Tapia Viñan, and J. Camacho Muñoz, “Feasibility analysis of charging stations for electric vehicles: Case study route e35, loja-cuenca in ecuador,” IOP Conference Series: Earth and Environmental Science, vol. 1370, no. 1, 2024. [Online]. https://doi.org/10.1088/1755-1315/1370/1/012003
[11] O. Farrerons Vidal and I. Roldán Aguilar, “Competición motostudent diseño de un carenado,” IV Jornada de Recerca Enginyeria Gràfica i de Disseny UPC, p. 10, 2022. [Online]. Available: https://upcommons.upc.edu/bitstream/handle/2117/364817/Dise%C3%B1o_carenado_competicion_Recerca_EGD_2022%20.pdf?sequence=1
[12] MotoStudent, V. Competición Internacional MotoStudent, 2018. [Online]. Available: https://www.academia.edu/32627471/Reglamento_de_la_Competici%C3%B3n
[13] T. Gómez Morales, J. M. Navarro, E. Águera Casado, and J. L. García Jiménez, Estructuras del vehículo. Paraninfo S.A., 2016.
[14] H. Granados, (2022). Aprender a usar SolidWorks Superficies - nivel principiante. [Online]. Available: https://intelligy.com/blog/2022/02/01/aprende-a-usar-solidworks-superficies-nivel-principiante/
[15] J. Constante, “Metodología de “análisis de densidad del aire” y “análisis horario”,” Instituto de Investigación Geológico y Energético, p. 7, 2022. [Online]. Available: https://www.geoenergia.gob.ec/wp-content/uploads/downloads/2022/05/documento_densidad_del_aire.pdf
[16] Y. F. Görgülü, M. A. Özgür, and R. Köse, “Cfd analysis of a naca 0009 aerofoil at a low reynolds number,” Politeknik Dergisi, vol. 24, no. 1, pp. 191-198, 2021. [Online]. https://doi.org/10.2339/politeknik.877391.
[17] S. Gancang, R. Sugeng, Abdurrouf, P. S. Setyawan, and N. Muhammad, “Stretched meshing in a 2d computational domain with elbow edges for cfd applications,” Journal of Advanced Research in Fluid Mechanics and Thermal Sciences, vol. 116, no. 2, pp. 41-50, 2024. [Online]. https://doi.org/10.37934/arfmts.116.2.4150.
[18] J. L. Vásquez, “Diseño asistido por computador y construcción de la carrocería de una moto eléctrica,” Ph.D. dissertation, Universidad Autónoma de Bucaramanga - UNAB, Colombia, 2020. [Online]. Available: https://redcol.minciencias.gov.co/Record/UNAB2_4fcad73f77b35585a14d2757eb168ed
[19] D. C. Wilcox, “Reformulation of the k-ω turbulence model revisited,” AIAA Journal, vol. 46, no. 11, pp. 2823-2838, 2008. [Online]. https://doi.org/10.2514/1.36541.
[20] E. Douvi and D. Margaris, “Evaluation of the turbulence models for the simulation of the flow over a national advisory committee for aeronautics (naca) 0012 airfoil,” Journal of Mechanical Engineering Research, vol. 4, no. 3, pp. 100-111, 2012. [Online]. https://doi.org/10.5897/JMER11.074.
[21] F. Stupenengo, Estructuras del vehículo. Inet, 2011. [Online]. Available: https://www.inet.edu.ar/wp-content/uploads/2012/11/materiales-compuestos.pdf
[22] S. Kalpakjian and S. R. Schmid, Manufactura, ingeniería y tecnología, 5th ed., México, 2008.
[23] T. L. Saaty and L. G. Vargas, Models, Methods, Concepts Applications of the Analytic Hierarchy Process, springer ed., United States, Jun 2012.
[24] C. Devals, T. C. Vu, Y. Zhang, J. Dompierre, and F. Guibault, “Mesh convergence study for hydraulic turbine draft-tube,” IOP Conference Series: Earth and Environmental Science, vol. 49, no. 8, 2016. [Online]. https://doi.org/10.1088/1755-1315/49/8/082021
[25] J. Leguisamo and D. Cuaspud, “Análisis estructural en cargas de impacto posterior por alcance de un bus interprovincial mediante el método de elementos finitos,” Ph.D. dissertation, Universidad Internacional SEK, Ecuador, 2018. [Online]. Available: https://repositorio.uisek.edu.ec/bitstream/123456789/2768/2/tesis%20impacto%20posterior%20%20bus.pdf
[26] E. R. Tapia Viñán and C. A. González Herrera, “Estudio de dimensionamiento y caracterización de un motor eléctrico en rueda para una motocicleta,” Ph.D. dissertation, Universidad Nacional de Loja, Ecuador, 2024. [Online]. Available: https://dspace.unl.edu.ec/jspui/handle/123456789/31555
[27] J. V. Molina Osejos and L. J. Trujillo Tinizaray, “Diseño aerodinámico del carenado de una motocicleta eléctrica fabricada en la usiek,” Ph.D. dissertation, Universidad Internacional SEK, Ecuador, 2022. [Online]. Available: https://repositorio.uisek.edu.ec/handle/123456789/4886
[28] D. P. Cajamarca Sumba and C. D. Vásquez Remache, “Diseño y construcción de la carrocería para el prototipo de competencia shell eco marathon,” Ph.D. dissertation, Universidad del Azuay, Ecuador, 2016. [Online]. Available: https://dspace.uazuay.edu.ec/handle/datos/6258
[29] Y. A. Çengel and J. M. Cimbala, Mecánica de Fluidos: Fundamentos y Aplicaciones, 1st ed. México: McGraw-Hill, 2012.
[30] K. Lluguay Duchi, “Desarrollar un modelo cfd para el análisis del comportamiento del fluido en tuberías del banco de perdidas de turbomaquinaria hidráulica y laboratorio,” Ph.D. dissertation, Escuela Superior Politécnica de Chimborazo, Ecuador, 2016. [Online]. Available: https://dspace.espoch.edu.ec/handle/123456789/4650
[31] Z. M. Saleh and A. H. Ali, “Numerical investigation of drag reduction techniques in a car model,” IOP Conference Series: Materials Science and Engineering, vol. 671, no. 1, 2020. [Online]. https://doi.org/10.1088/1757-899X/671/1/012160.
[32] A. N. M. M. I. Mukut and M. Z. Abedin, “Review on aerodynamic drag reduction of vehicles,” International Journal of Engineering Materials and Manufacture, vol. 4, no. 1, pp. 1-10, 2019. [Online]. https://doi.org/10.26776/ijemm.04.01.2019.01
[33] R. D. R. Mariaprakasam, S. Mat, P. Mohd Samin, N. Othman, M. Ab Wahid, and M. Said, “Review on flow controls for vehicles aerodynamic drag reduction,” Journal of Advanced Research in Fluid Mechanics and Thermal Sciences, vol. 101, no. 1, pp. 11-36, 2023. [Online]. https://doi.org/10.37934/arfmts.101.1.1136
[34] N. Bekraoui, Z. El Qoubaa, and E. Essadiqi, “Weibull integrated ahp for the selection of natural fiber composites material,” Jordan Journal of Mechanical and Industrial Engineering, Mar 2023. [Online]. Available: 05_JJMIE_263_22
[35] W. P. Medina Toledo and J. F. Morocho Salinas, “Diseño y construcción de manguetas y cubos de rueda de un vehículo de competencia fórmula sae eléctrico,” Ph.D. dissertation, Universidad Politécnica Salesiana Sede Matriz Cuenca, Ecuador, 2017. [Online]. Available: https://dspace.ups.edu.ec/handle/123456789/15056
[36] F. Yu, J. Xie, and Z. M. Xu, “The vibration reduction design of single-cylinder engine based on the balance shaft,” Vibroengineering Procedia, vol. 26, pp. 20-25, 2019. [Online]. https://doi.org/10.21595/vp.2019.20651